

Good sleep is critical not only to your mind and body but also to the safety of others. Each year, 98,000 deaths occur in U.S hospitals due to medical errors, in which sleep deprivation is a significant contributor. Additionally, an estimated 100,000 vehicle crashes are caused by drowsy driving every year, according to the National Highway Traffic Safety Administration. Getting less than seven hours of sleep also increases your risk of developing arthritis, depression, asthma, and many other chronic health conditions. To get a pulse on what’s keeping Americans awake at night, we surveyed 2,000 adults.
Key findings:
- One in 5 people takes 3 or more hours to fall asleep.
- A third are dissatisfied with their sleep quality.
- 77% experience one or more sleep disturbances.
- 89% wake up at least once during the night.
- 15% take at least one nap a day.
- Three-quarters doze off during the day.
- Insomnia, sleep apnea, and chronic pain were the most reported sleep disorders among respondents.
- Caffeine intake, smartphones, and stress are the most reported interferences of sleep quality.
- Nearly half changed their diet to fall asleep faster or sleep better.
- 44% use sleep aids.
RELATED: See sleep statistics by age | See sleep statistics by sex
It takes 1 in 5 people three or more hours to fall asleep
It should take less than 20 minutes to fall asleep once you lie down, according to Sleep Doctor. This was the case for 38% of respondents who reported falling asleep within an hour. The other 62% of survey takers reported spending an hour or more to fall asleep.
44% get less than the recommended amount of sleep
The Centers for Disease Control and Prevention (CDC) recommends adults (18 to 60 years old) get seven or more hours of sleep. Adults between 61 and 64 years old should get seven to nine hours of sleep, and those who are 65 and older should get seven to eight hours. Only 56% reported getting the recommended amount of sleep.
Time spent falling asleep vs. sleeping |
||
|---|---|---|
| Time duration | Time spent falling asleep | Time spent sleeping |
| Less than 1 hour | 38% | < 1% |
| 1 hour | 27% | < 1% |
| 2 hours | 14% | < 1% |
| 3 hours | 5% | 2% |
| 4 hours | 2% | 5% |
| 5 hours | 1% | 12% |
| 6 hours | 3% | 23% |
| 7 hours | 3% | 29% |
| 8 hours | 4% | 19% |
| 9 hours | 1% | 6% |
| 10 hours | 1% | 2% |
| 11 hours | < 1% | < 1% |
| 12+ hours | < 1% | < 1% |
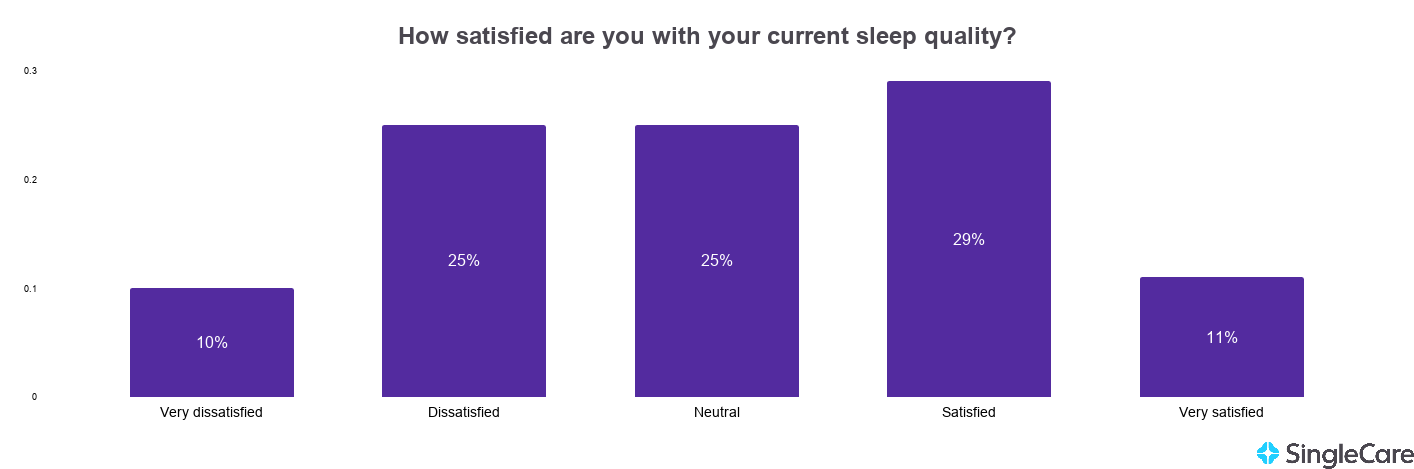
A third are dissatisfied with their sleep quality
Our sleep survey found that 35% of respondents were either dissatisfied or very dissatisfied with their sleep quality. Respondents aged 35 to 45 had the highest dissatisfaction with sleep quality, whereas seniors (65 and older) reported the highest level of sleep satisfaction.
- 11% are very satisfied
- 29% are satisfied
- 25% are neutral
- 25% are dissatisfied
- 10% are very dissatisfied
77% experience one or more sleep disturbances
We asked respondents whether they or their bed partner experienced any sleep disturbances, and the majority reported experiencing them. Trouble falling asleep and staying asleep were the most commonly reported disturbances. Sleep paralysis, acting out dreams (REM sleep behavior disorder), and sleepwalking were less common.
- 42% have trouble falling asleep
- 41% have trouble staying asleep
- 26% are easily awakened by noise, light, and/or other things
- 24% lie awake at night feeling worried, depressed, and/or anxious
- 23% snore so loudly that it would bother others near them
- 17% have restless legs, twitches, jerks, or startled movements during sleep
- 13% have frightening dreams, nightmares, and/or night terrors
- 12% are bothered by physical problems and sensations at night, such as palpitations, chest pain, or chronic pain
- 10% have trouble breathing at night, awaken choking or gasping, and/or have others say that they stop breathing in their sleep
- 8% sleep talk
- 6% have heard a voice or seen things while falling asleep or awakening
- 5% have had sleep paralysis
- 4% act out their dreams
- 2% sleepwalk
- 23% reported none of the above
89% wake up at least once during the night
Only 11% of respondents reportedly sleep through the night. On average:
- 11% sleep through the night without waking up
- 28% wake up once
- 30% wake up twice
- 20% wake up three times
- 6% wake up four times
- 5% wake up five or more times
15% take at least one nap a day
Research shows that napping has health benefits; however, there are a few conditions. The best time for older adults to nap is between 1 and 4 p.m., and a nap should be limited to 20 to 40 minutes to avoid grogginess throughout the rest of the day or insomnia at night. Additionally, napping one or more times a day could be a sign of inadequate sleep and may contribute to a cycle of difficulty falling asleep at night. We found that most respondents never nap or only occasionally.
- 33% never nap
- 52% occasionally nap
- 12% nap once a day
- 3% nap multiple times a day
Three-quarters doze off during the day
Despite most respondents reporting that they never or only occasionally nap, 73% reported unintentionally dozing off during the day.
- 56% doze off while watching television
- 37% doze off while reading
- 20% doze off as a passenger in a vehicle
- 11% doze off while sitting inactive in a public place (i.e., in a theater or a meeting)
- 4% doze off while talking to someone
- 3% doze off while driving
- 3% doze off in other situations (such as while using the computer, listening to podcasts or audiobooks, at work, after a big meal, etc.)
- 3% doze off as a driver in a car while stopped for a few minutes (in traffic or at a traffic stop)
- 27% never doze off during the day
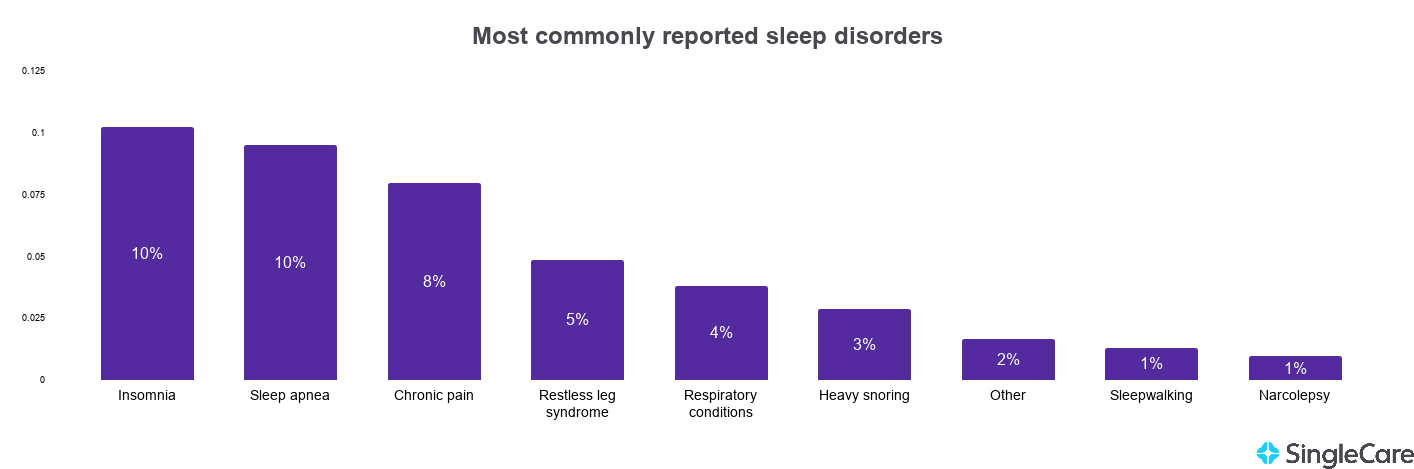
Insomnia, sleep apnea, and chronic pain were the most reported sleep disorders among respondents
A quarter of respondents reported that they’d been diagnosed with a sleep disorder. An additional 5% said that they’d seen a doctor for sleeping problems, but they haven’t been diagnosed with a disorder. It’s not surprising that insomnia was the most commonly reported sleep disorder in our sleep survey, as 1 in 4 Americans develops acute insomnia each year.
- 70% have never been diagnosed with a sleep disorder
- 10% have insomnia
- 10% have sleep apnea
- 8% have chronic pain
- 5% have seen a doctor for sleeping problems, but haven’t been diagnosed with a sleep disorder
- 5% have restless leg syndrome
- 4% have COPD or another respiratory condition
- 3% have heavy snoring
- 1% sleepwalk
- 1% have narcolepsy
- <1% have other sleep disorders (bipolar disorder, PCOS, MS, osteoporosis, Type 2 diabetes, PTSD)
- <1% have shift work disorder
Caffeine intake, smartphones, and stress are the most reported interferences of sleep quality
Caffeine intake was the number one reported cause of poor sleep quality among our respondents. Eighty-five percent of the population drinks at least one caffeinated beverage per day, according to the Institute for the Advancement of Food and Nutrition Sciences. It’s recommended to limit coffee consumption to at least 8 hours before bedtime.
- 29% reported caffeine intake
- 26% reported using their phone before bed
- 26% reported stress at home
- 23% reported financial stress
- 20% reported watching television or movies
- 17% reported that their mattress, bedding, and/or pillows are uncomfortable
- 13% reported stress about the COVID-19 pandemic
- 12% reported workplace or job security stress
- 10% reported alcohol use
- 8% reported their bed-partner’s sleeping problems keep them awake
- 7% reported other interferences (i.e., needing to use the bathroom, pets, eating before bed, breastfeeding)
- 6% reported smoking cigarettes
- 5% reported insomnia or restlessness as a side effect of medication
- 4% reported their bed-partner uses their phone before bed
Nearly half changed their diet to fall asleep faster or sleep better
A third (33%) of respondents reported limiting their caffeine and/or sugar intake. Thirteen percent reported other dietary changes, such as limiting water intake, portion sizes, and/or acidic foods before bed. That’s 46% of respondents who reported making some diet changes to fall asleep faster or to sleep better. Other reported activities included:
- 29% watch television or movies
- 26% read
- 24% increase in physical activity during the day
- 21% listen to soothing music or a sound machine
- 20% reported none of the above
- 19% set a bedtime/wake-up schedule
- 18% use stress-relief exercises (deep breathing, meditation, etc.)
- 9% limit alcohol and/or tobacco use
- 6% reported other activities (taking medication, drinking hot tea, using lavender oil)
- 5% sleep separately from their bed-partner
- 5% use a CPAP machine
- 4% track their sleep with a device
- 3% use a dental guard for teeth grinding
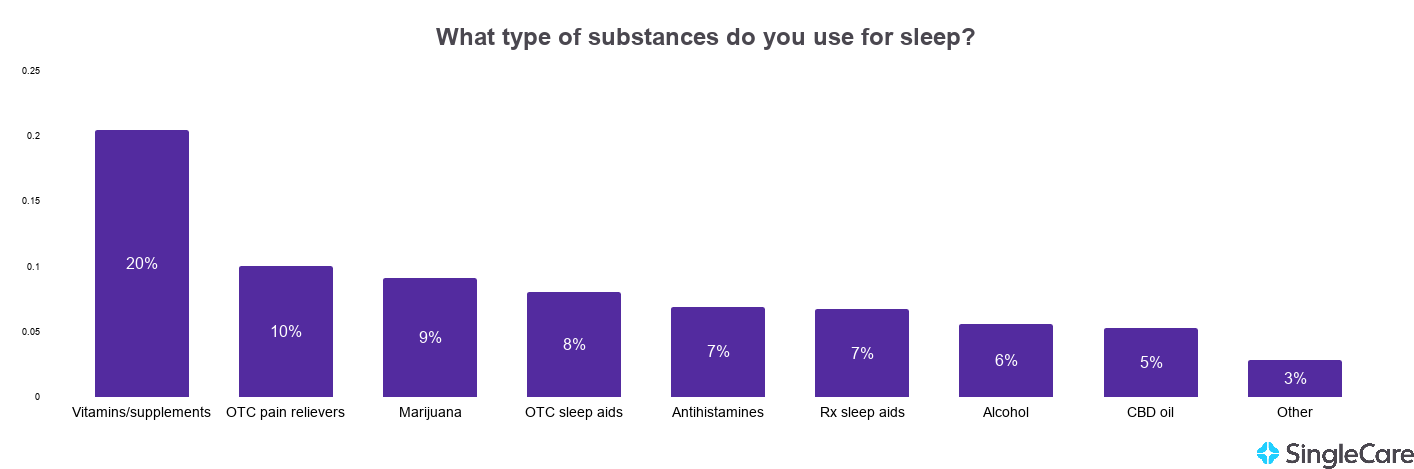
44% use sleep aids
People with sleeping problems try to treat their symptoms at home before seeking medical help. Natural remedies were the most popular sleep aids among survey takers. Up to a third use some type of natural substance, including vitamins, supplements, marijuana, and/or CBD oil. Over-the-counter medicines were also common, with 25% of respondents reportedly using them. Only 7% reported using prescription sleep aids.
- 20% take natural vitamins and supplements, such as melatonin or magnesium
- 10% take over-the-counter pain relievers like Tylenol PM or ZzzQuil
- 9% use marijuana
- 8% take over-the-counter sleep aids, such as Unisom
- 7% take antihistamines that cause drowsiness, like Benadryl
- 7% use prescription sleep aids (Lunesta, Ambien, Restoril, etc.)
- 6% drink alcohol
- 5% use CBD oil
- 3% reported other substances (most commonly tea and antidepressants)
Sleep aids are not without side effects, though. Those who take antihistamines as a sleep aid had the highest rates of:
- Physical problems such as palpitations, chest pain, and chronic pain at night (31%)
- Trouble breathing at night (28%)
- Hearing voices or seeing things while falling asleep or awakening (18%)
- Sleep paralysis (12%)
Those who take prescription sleep aids had the highest rate of frightening dreams, nightmares, and night terrors.
And those who didn’t use any sleep aid had the highest satisfaction with their sleep quality.
Sleep statistics by age
According to our survey results, sleep disturbances affect 25- to 64-year-olds the most. Young adults (18 to 24) are more likely to sleep through the night than any other age group, and seniors (65 and older) have the lowest rate of sleep disturbance.
Sleep stats by age |
|
|---|---|
| Age range (years) | Survey results |
| 18-24 |
|
| 18-34 |
|
| 25-34 |
|
| 35-45 |
|
| 55-64 |
|
| 65+ |
|
Sleep statistics by sex
Sleep disturbances and disorders affect men and women differently. Snoring and sleep apnea appear to affect males more than females due to airway anatomy, breath control, hormones, and aging. On the other hand, insomnia is more prevalent in females, most likely because of hormonal changes.
Sleep stats by sex |
|
|---|---|
| Male | Female |
| 29% more likely to fall asleep within an hour of going to bed | 23% more likely to believe they have sleeping problems due to using their phone before bed |
| 2x as likely to fall asleep while driving | Report being diagnosed with insomnia 42% more than males |
| 2x as likely to believe their sleeping problems stem from alcohol use and smoking cigarettes | 2x as likely to be bothered by physical problem at night (palpitations, chest pain, chronic pain) |
| Report being heavy snorers twice as much as females | 2x as likely to be awakened by noise, light, and/or other things |
| 56% more likely to be diagnosed with sleep apnea | 62% more likely to lie awake at night feeling worried, depressed, and/or anxious |
Our methodology
SingleCare conducted this sleep survey online through AYTM on February 27, 2021. This survey includes 2,000 United States adults ages 18+. Age and gender were census-balanced to match the U.S. population in age, gender, and U.S. region.
- Sleep deprivation and physician performance: Why should I care? Baylor University Medical Center Proceedings (2005)
- Drowsy driving prevention week, National Sleep Foundation (2025)
- How is sleep quality calculated? Sleep Doctor (2025)
- About sleep, Centers for Disease Control and Prevention (2024)
- Can a nap boost brain health? Johns Hopkins Medicine
- One in four Americans develop insomnia each year: 75 percent of those with insomnia recover, University of Pennsylvania School of Medicine (2018)
- Caffeine intake, The Institute for the Advancement of Food and Nutrition Sciences
- The effect of caffeine on subsequent sleep: A systematic review and meta-analysis, Sleep Medicine Reviews (2023)
- The gender gap in obstructive sleep apnea: unmasking the disproportionate costs on women, Sleep (2025)
- Insomnia, Office on Women’s Health (2025)