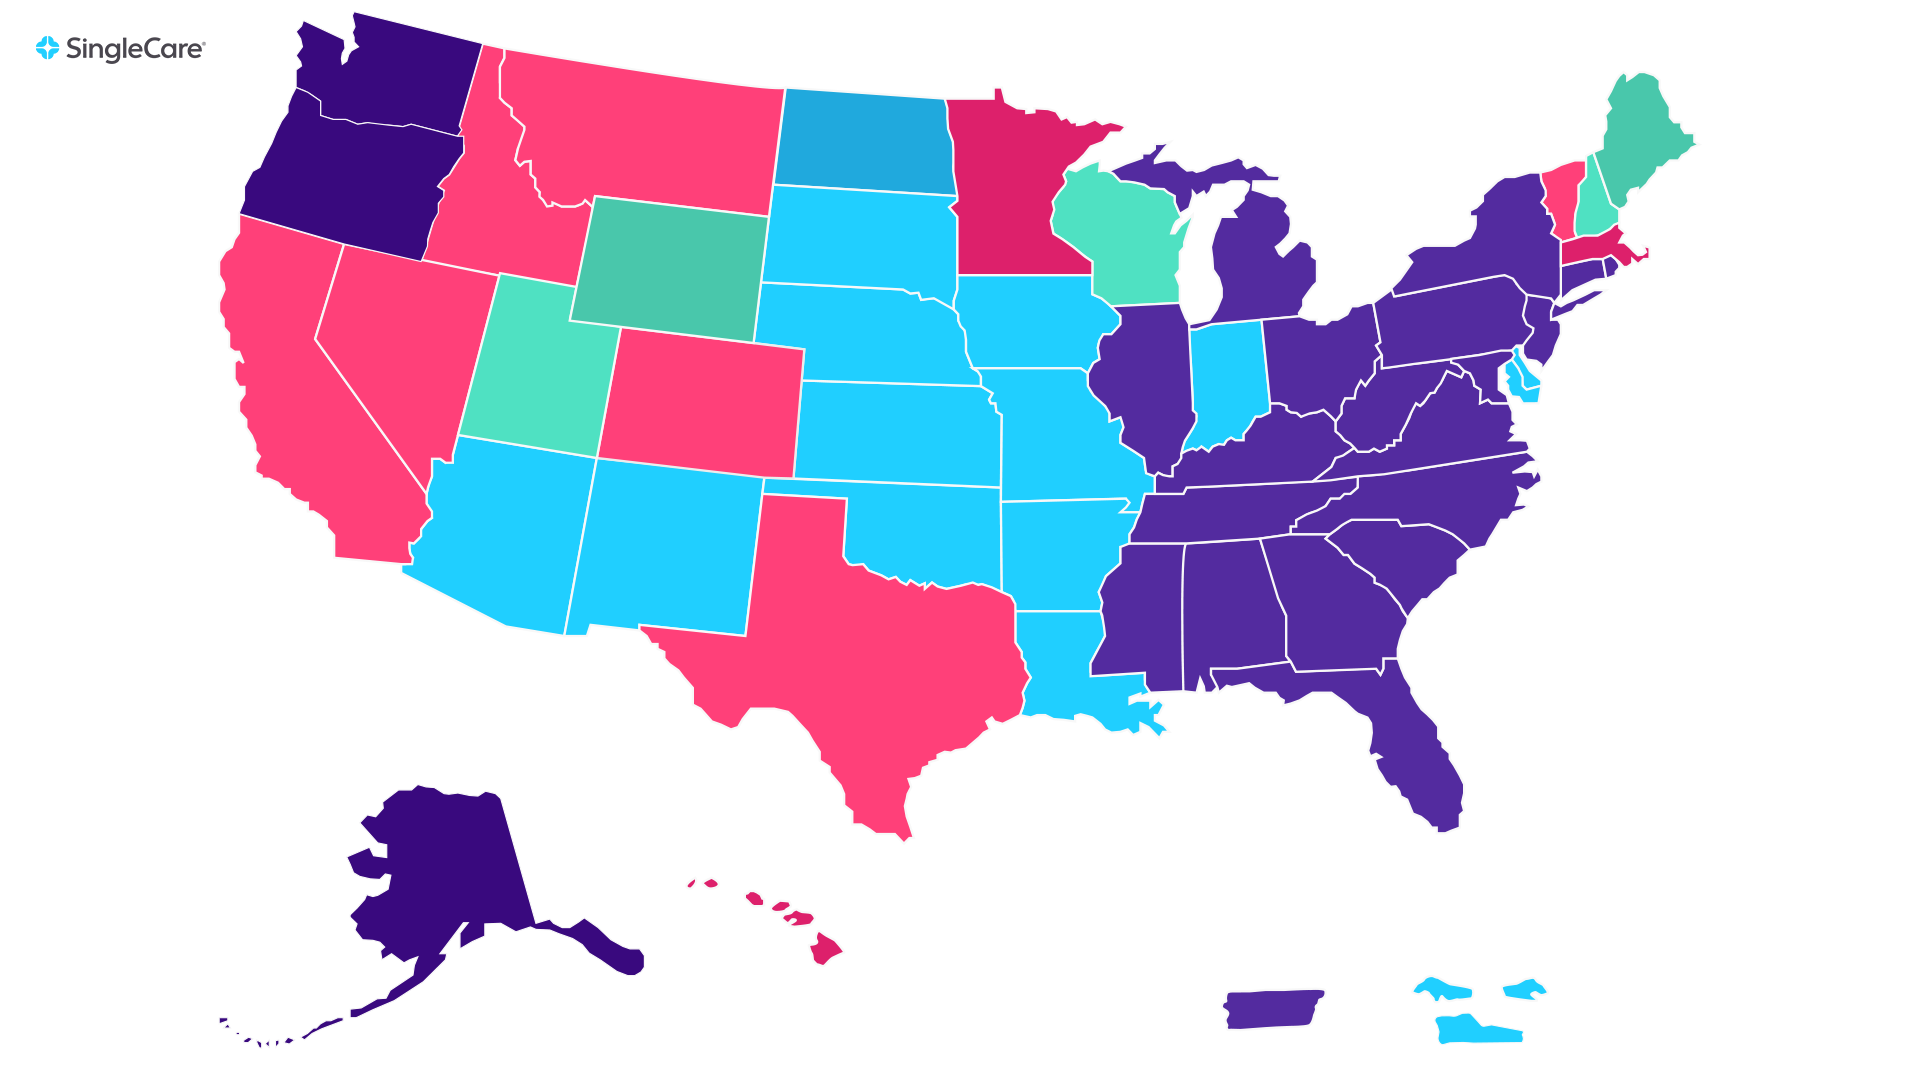
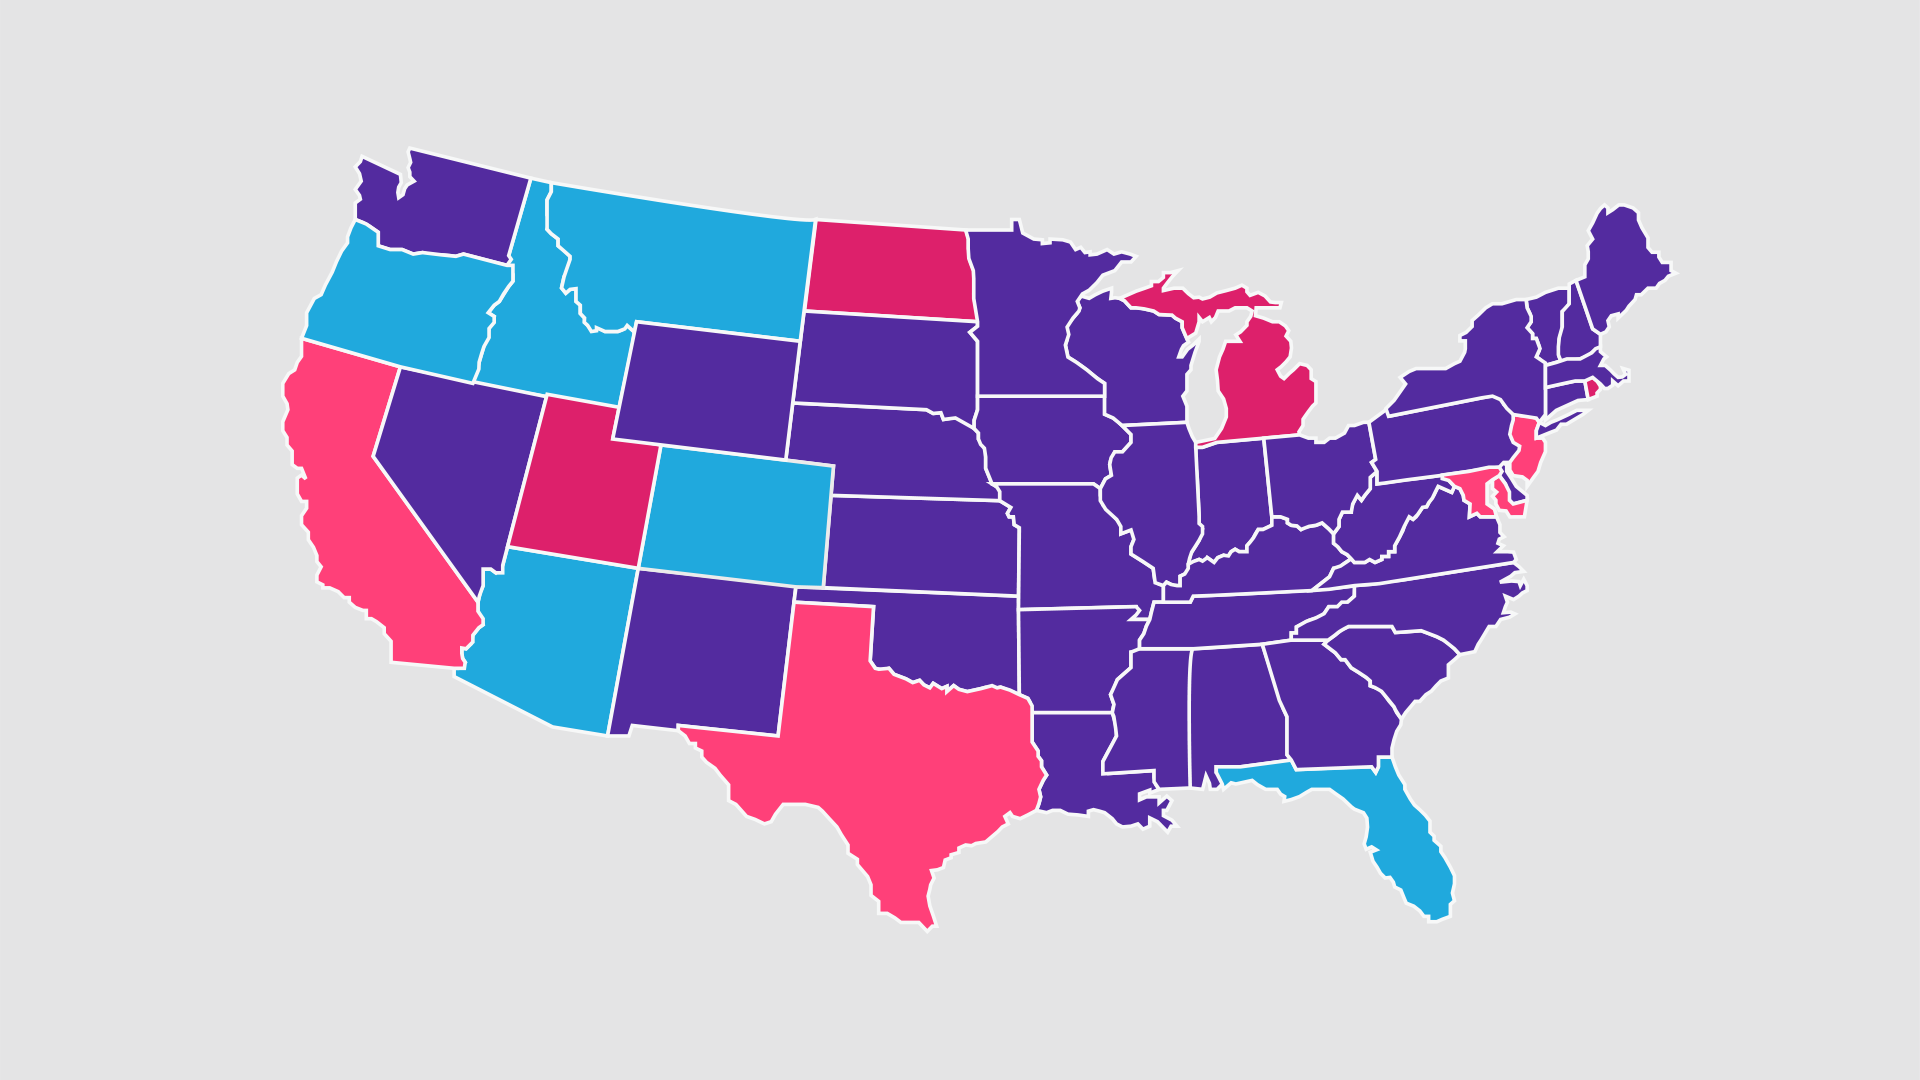
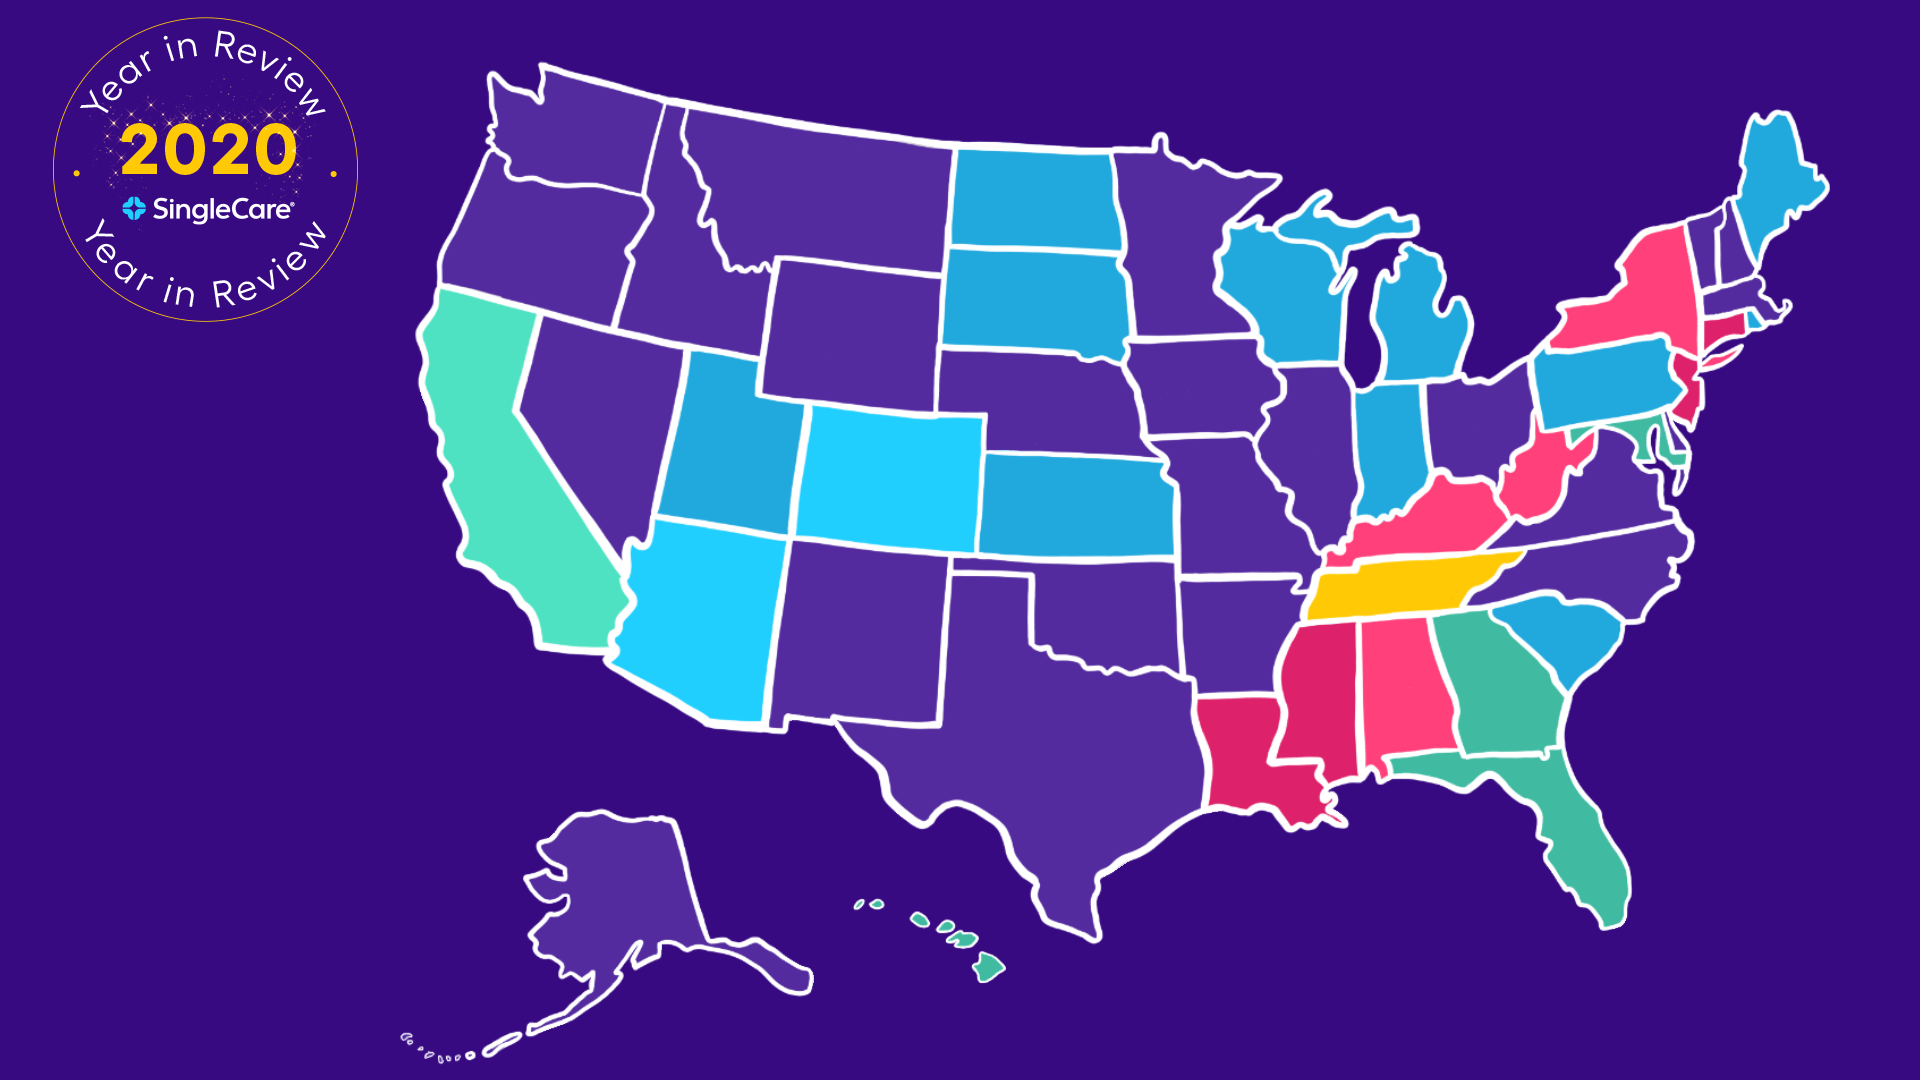
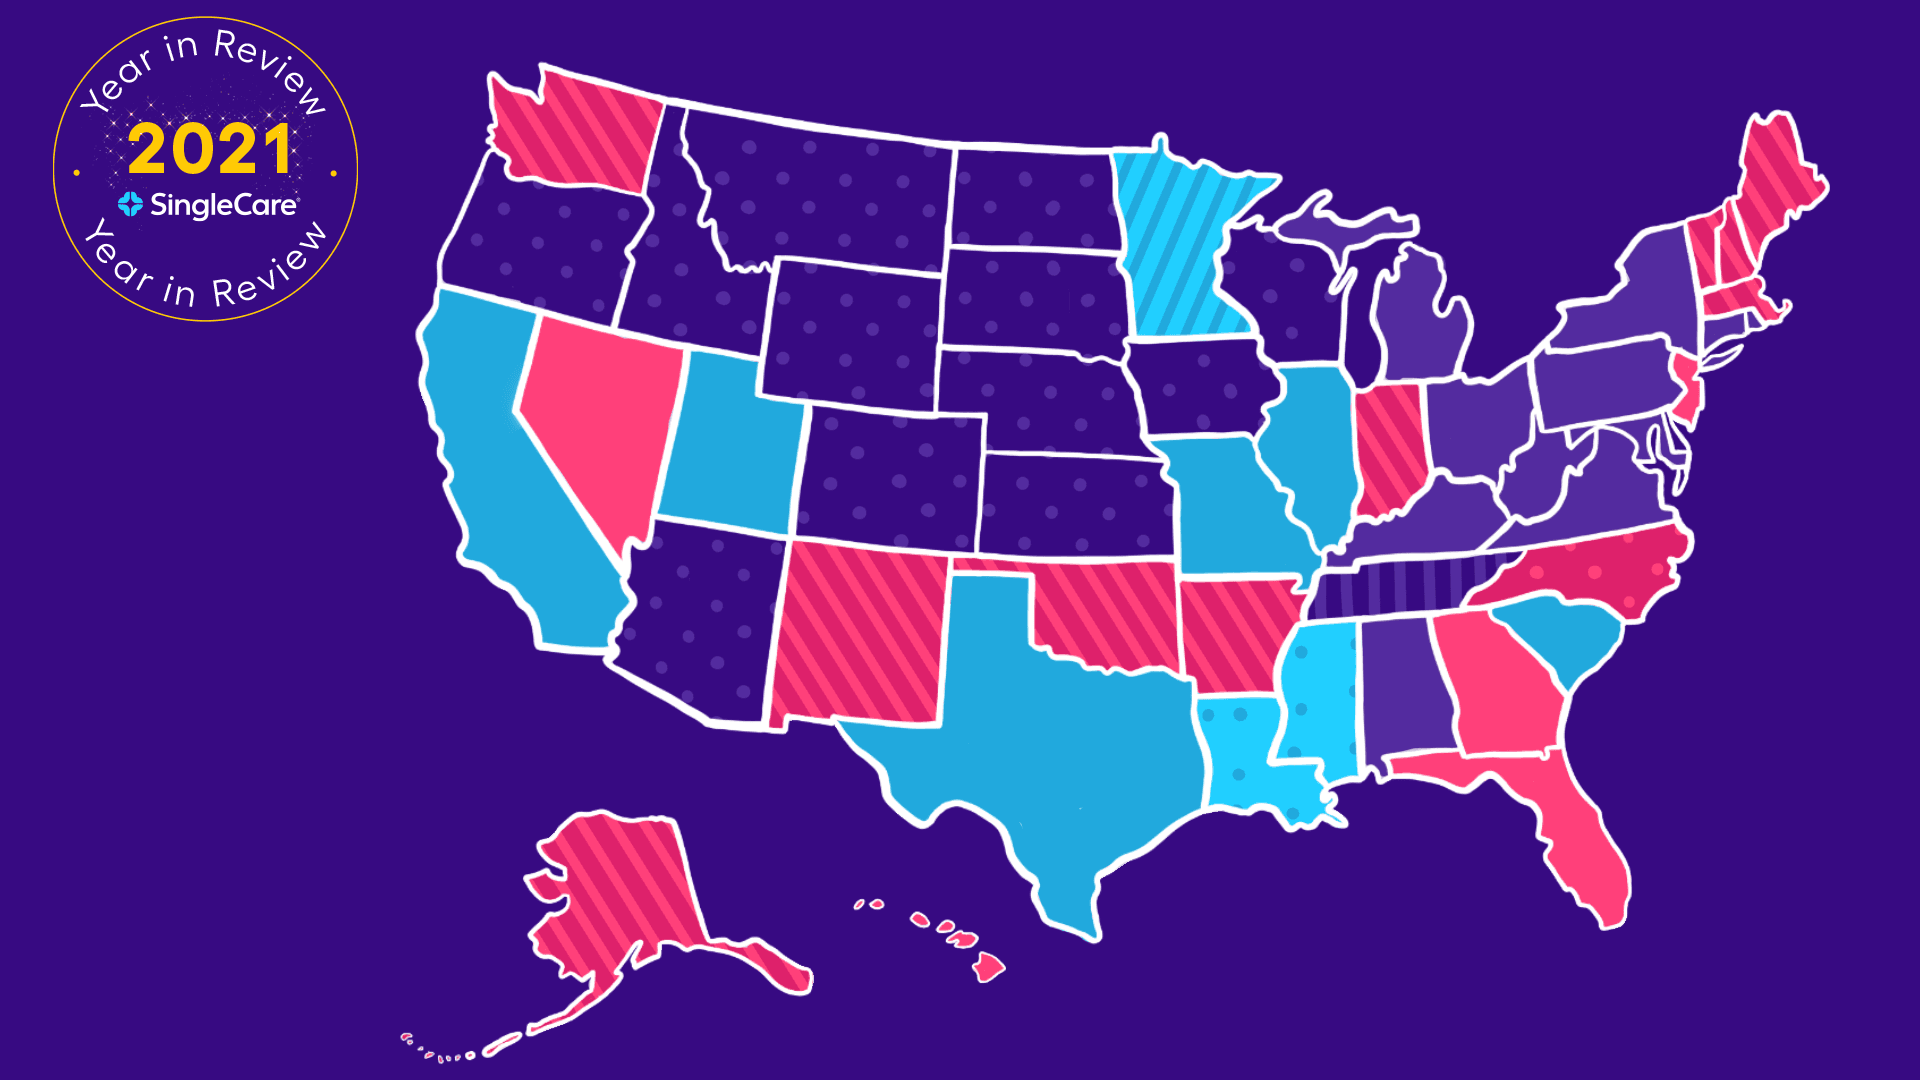
Map of America with charts and graphs: Eating disorder statistics
News

Eating disorder statistics 2024

Global eating disorder statistics increased from 3.4% to 7.8%. Use these eating disorder stats to understand why the prevalence of eating disorders.
Map of America with charts and graphs: Depression statistics
News

Depression statistics 2024

More than 7% of adults are diagnosed with depression, but people aged 12-25 have the highest rates of depression. See depression stats by age and cause.
Map of America with charts and graphs: OCD statistics
News

OCD statistics 2024

About 2.3% of the population has OCD. Although debilitating, OCD stats show that treatment is effective.
Map of America with charts and graphs: Schizophrenia statistics
News

Schizophrenia statistics 2024

20 million people have schizophrenia but less than a third receive treatment. These schizophrenia statistics illustrate the prevalence and treatment gap of the disorder.
Map of America with charts and graphs: Bipolar disorder statistics
News

Bipolar disorder statistics 2024

46 million people around the world, including 2.8% of the U.S. population, have bipolar disorder. See more bipolar statistics here.
Map of America with charts and graphs: ADHD statistics in children, teens, and adults
News

ADHD statistics 2024

An estimated 6.1 million children have ADHD in the U.S., but adult ADHD statistics are rising
Map of America with charts and graphs: Autism statistics
News

Autism statistics 2024

1 in 54 children has autism in the U.S. Autism statistics have increased, but is autism really an epidemic?
Map of America with charts and graphs: Vaccination and immunization statistics
News

Immunization and vaccination statistics 2024

Immunization prevents 2-3 million deaths each year. Still, some doubt vaccine safety. These vaccination stats show that the benefits outweigh the risks.
Map of America with charts and graphs: Find statistics for anxiety, depression, bipolar disorder, and more
News

Mental health statistics 2024

These mental health statistics illustrate the prevalence of mental illness, the most common mental health issues, and their treatment options
Map of America with charts and graphs: How common is ED?
News

Erectile dysfunction statistics 2024

Erectile dysfunction statistics show that ED in young men is less common but increasing
Map of America with charts and graphs: Diabetes statistics and facts
News

Diabetes statistics 2024

An American is diagnosed with diabetes every 17 seconds. Learn why diabetes statistics are rising.