


Key takeaways
91% believe preventive care is important to health and longevity; however, 24% have not received any preventive care in the past year.
25% have not visited their primary care provider in the past year; 29% of them do not have a primary care provider.
Primary care, specialty care, and telehealth services were the most commonly visited health centers.
Only 6% were reportedly unsatisfied with the most recent health care they received.
A third or more of respondents take at least one of the following steps when they get sick: take over-the-counter medicine, visit their primary care provider, try natural remedies, and search the internet to self-diagnose their illness.
33% reported they would go to the emergency room for non-emergency health problems.
Coping with a global pandemic has led to an array of unhealthy habits and lifestyle changes in many people. At the beginning of the pandemic, SingleCare conducted a survey and found that 22% reported exercising less, 17% were eating more, 10% were drinking more alcohol. A more recent survey by The Harris Poll found that these numbers were even higher a year after the pandemic. Sixty-one percent reported undesired weight changes and 23% were reportedly drinking more alcohol than before the pandemic. What’s more is that 47% of Americans said they delayed or canceled health care services since the pandemic began. In our latest healthcare survey, SingleCare explored why Americans are forgoing doctor’s visits and what they do instead when they get sick.
91% believe preventive care is important, but 24% have not received any preventive care in the past year
Although the majority of survey respondents believe that preventive care is important to their health and longevity, less than a quarter of them received any preventive care in the past year. Of those who did receive preventive care services, annual checkups, annual flu shots, cholesterol checks, and routine immunizations were the most commonly reported.
- 62% received an annual checkup
- 39% received an annual flu shot
- 35% received a cholesterol check
- 26% received routine immunizations
- 24% did not receive any preventive health services in the past year
- 18% received a breast exam
- 17% received a mammogram
- 15% received a Pap smear
- 12% received a colonoscopy
- 11% received a full-body skin check
- 10% received a pelvic exam
- 9% received a prostate screening
- 6% received a bone density study
- 6% received a testicular exam
- 5% received other preventive health services in the past year
RELATED: Do I need an annual physical exam?
Our survey also found that males were more likely to receive preventive health services than females.
Preventive health services in females vs. males |
||
|---|---|---|
| % of females | % of males | |
| Annual check-up | 62% | 62% |
| Routine immunizations | 23% | 29% |
| Annual flu shot | 35% | 43% |
| Cholesterol check | 33% | 38% |
| Full-body skin check | 10% | 12% |
| Colonoscopy | 10% | 14% |
| Bone density study | 9% | 3% |
RELATED: Cancer screenings for women | Cancer screenings for men
Additionally, 24% of survey respondents reportedly don’t know that the cost of preventive care is covered by most health insurance providers. According to healthcare.gov, most health insurance plans must cover a set of preventive services at no cost to the patient as long as the healthcare provider is in-network.
25% have not visited their primary care provider in the past year
Although the majority of survey takers visited their primary care provider at least once in the past year, a quarter of them reported not having a primary care provider at all.
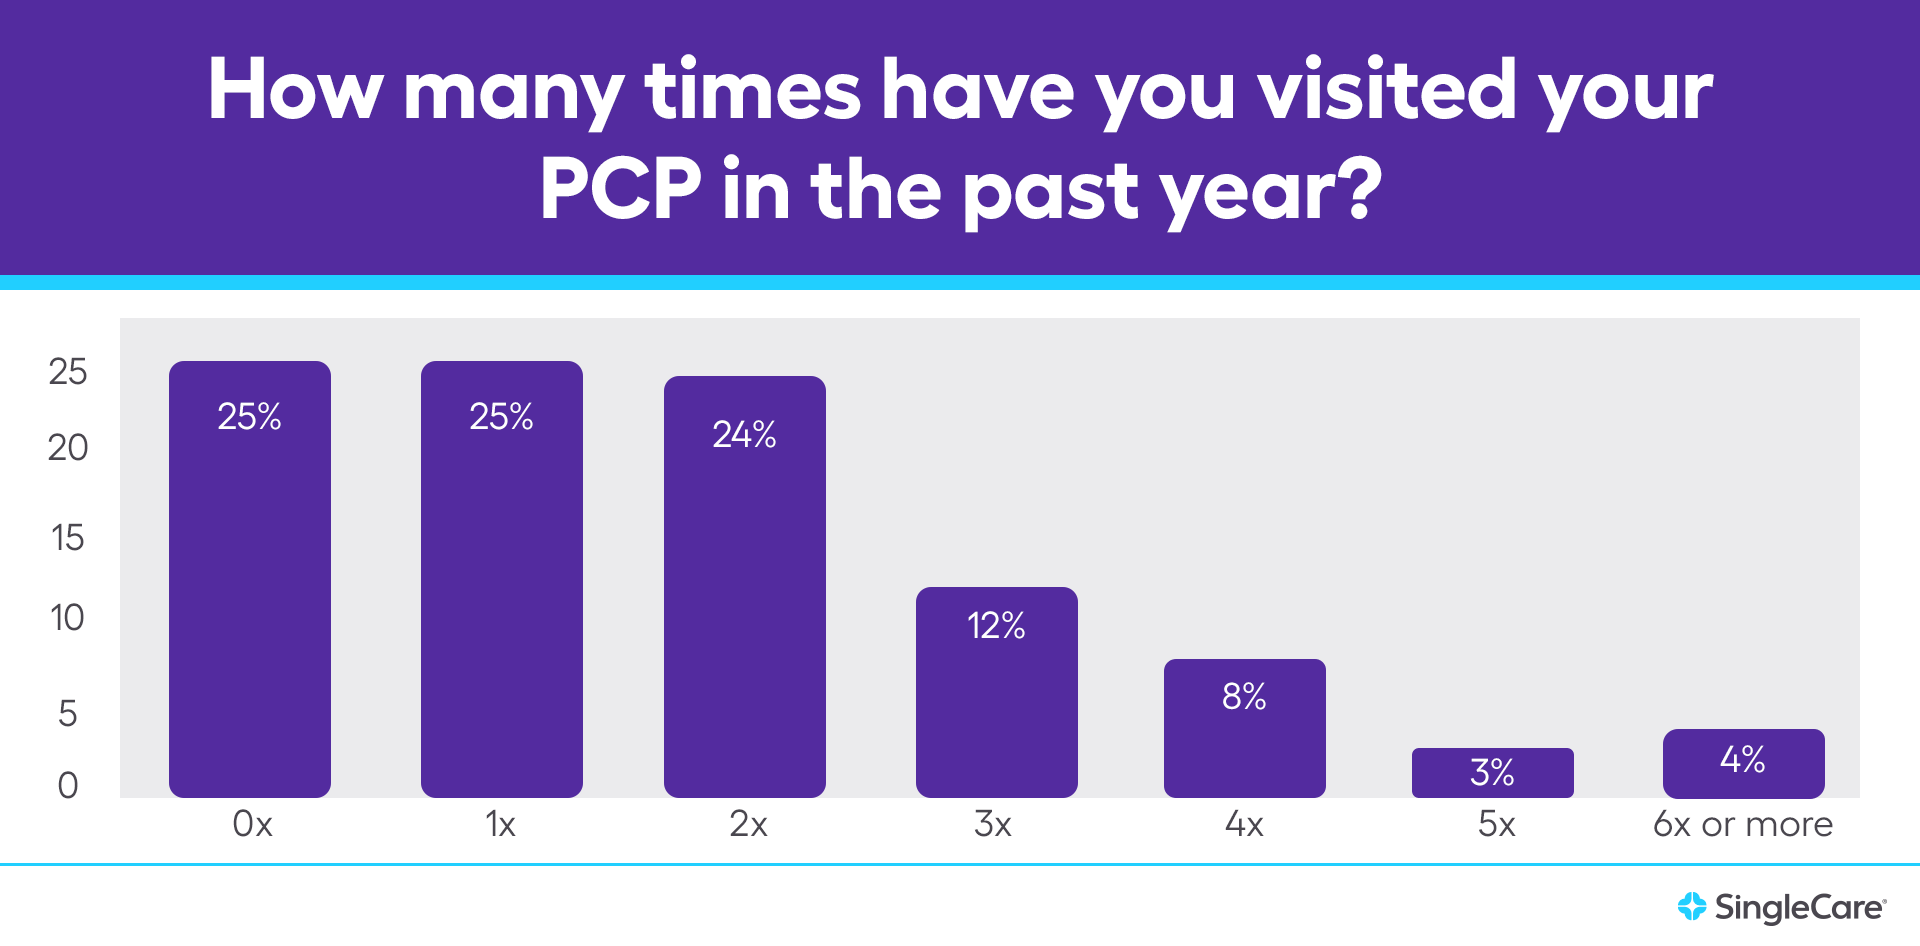
- 25% have not visited their primary care provider in the past year
- 25% visited their primary care provider once
- 24% visited their primary care provider twice
- 12% visited their primary care provider three times
- 8% visited their primary care provider four times
- 3% visited their primary care provider five times
- 4% visited their primary care provider six or more times
 Of those who reported not visiting their primary care provider in the past year:
- 37% reportedly haven’t felt sick
- 29% reportedly do not have a primary care provider
- 27% reported cost as a reason why they haven’t visited their provider
- 23% reported they dislike going to the doctor
- 22% reported being afraid of getting sick or catching COVID-19 from their doctor’s office
- 14% reported other reasons
- 13% reported time as a reason why they haven’t visited their provider
- 10% reported transportation as a reason why they haven’t visited their provider
- 10% reportedly did not want to do recommended preventive care
- 9% reportedly do not trust doctors
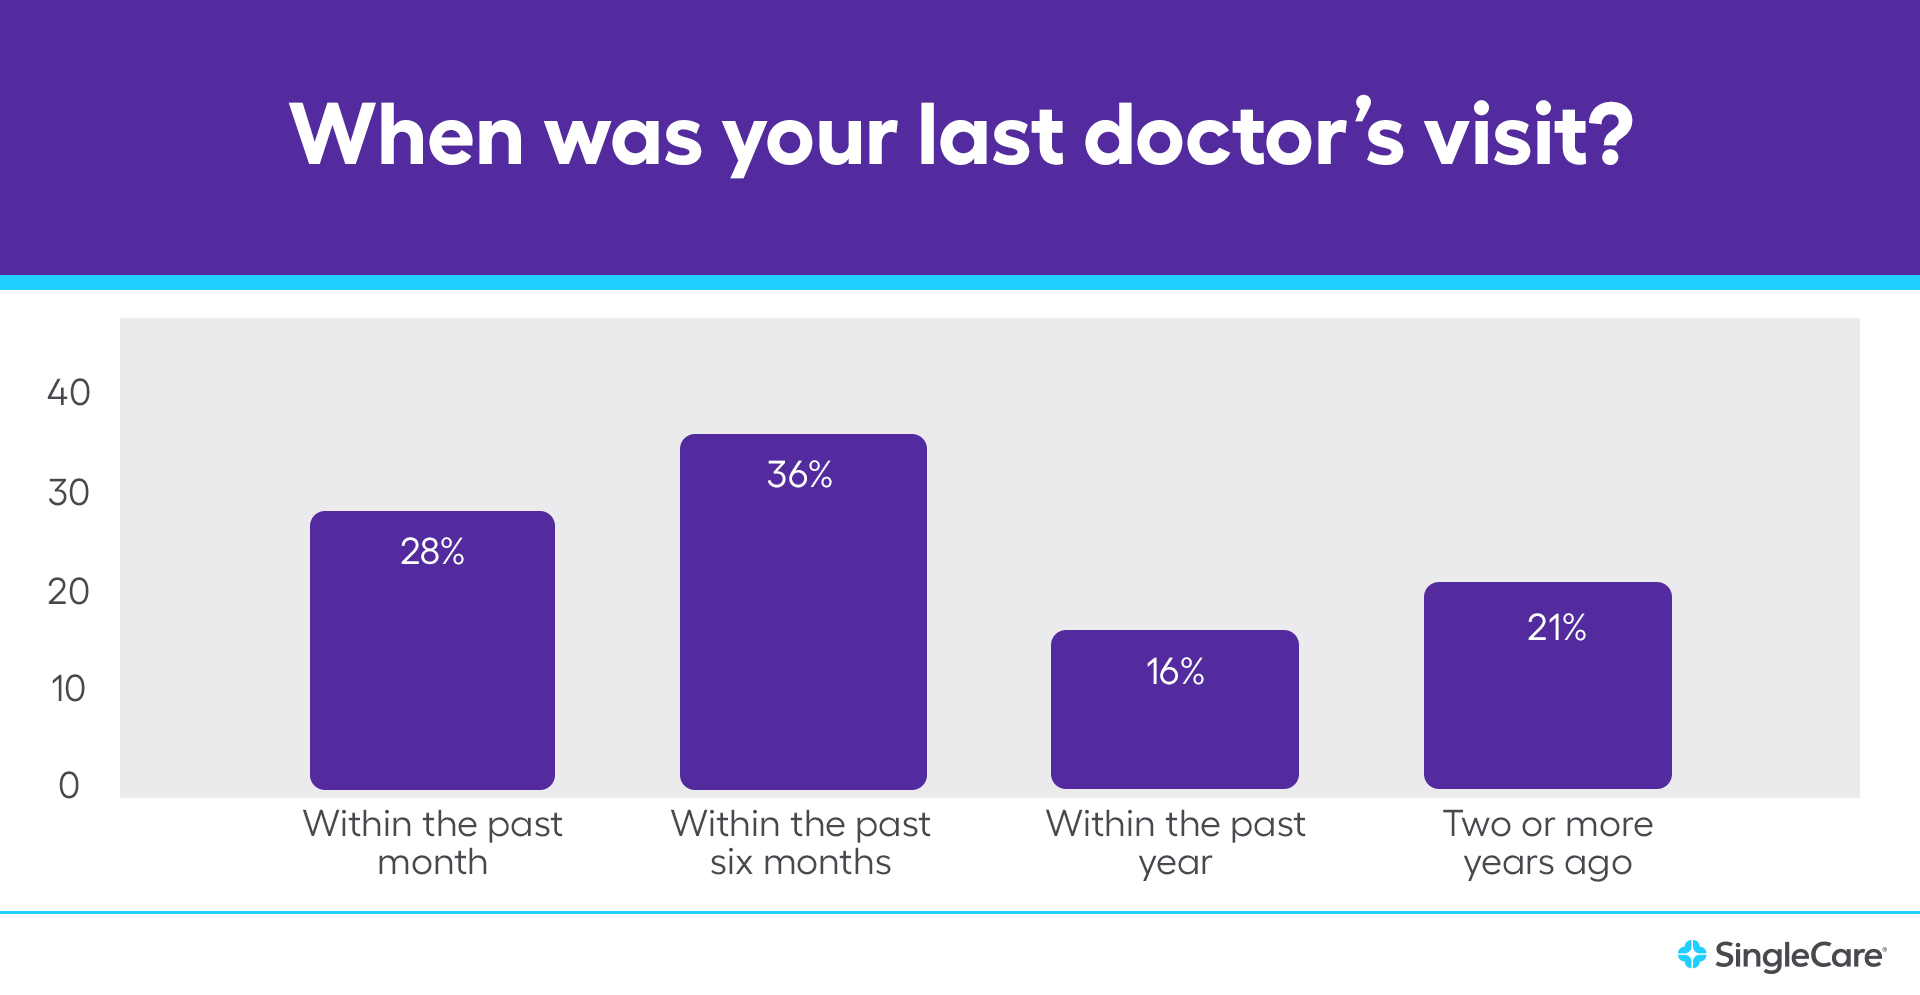
In fact, 21% of respondents have not seen a doctor (including telehealth) in two or more years:
- 28% saw a doctor within the past month
- 36% saw a doctor within the past six months
- 16% saw a doctor within the past year
- 9% saw a doctor two years ago
- 3% saw a doctor three years ago
- 1% saw a doctor four years ago
- 8% saw a doctor five or more years ago
Primary care, specialty care, and telehealth services were the most visited health centers
We asked survey respondents which of the following types of health centers they have visited in the past year. Nearly two-thirds reported visiting a primary care office in the past year.
- 64% visited their primary care office
- 27% visited a specialty care office, such as a cardiologist, endocrinologist, oncologist, etc.
- 17% reported none of the above
- 17% had a telehealth visit
- 16% visited urgent care
- 12% visited the emergency room
- 11% visited the hospital
- 10% visited a retail clinic, such as the CVS MinuteClinic or Walmart’s Care Clinic
- 7% visited a mental health provider and/or addiction treatment center
- 5% visited an outpatient surgical center
- 4% visited a community health center (a network of clinics with general practitioners and nurses providing health care in a certain area)
- 2% visited the VA medical center
- 2% visited other types of health centers
- 2% visited a mobile clinic (vehicles that travel to communities to provide health care where people work, live, and play)
- 1% visited a rural health clinic (located in a rural, medically underserved area)
Only 6% were reportedly unsatisfied with the most recent health care they received
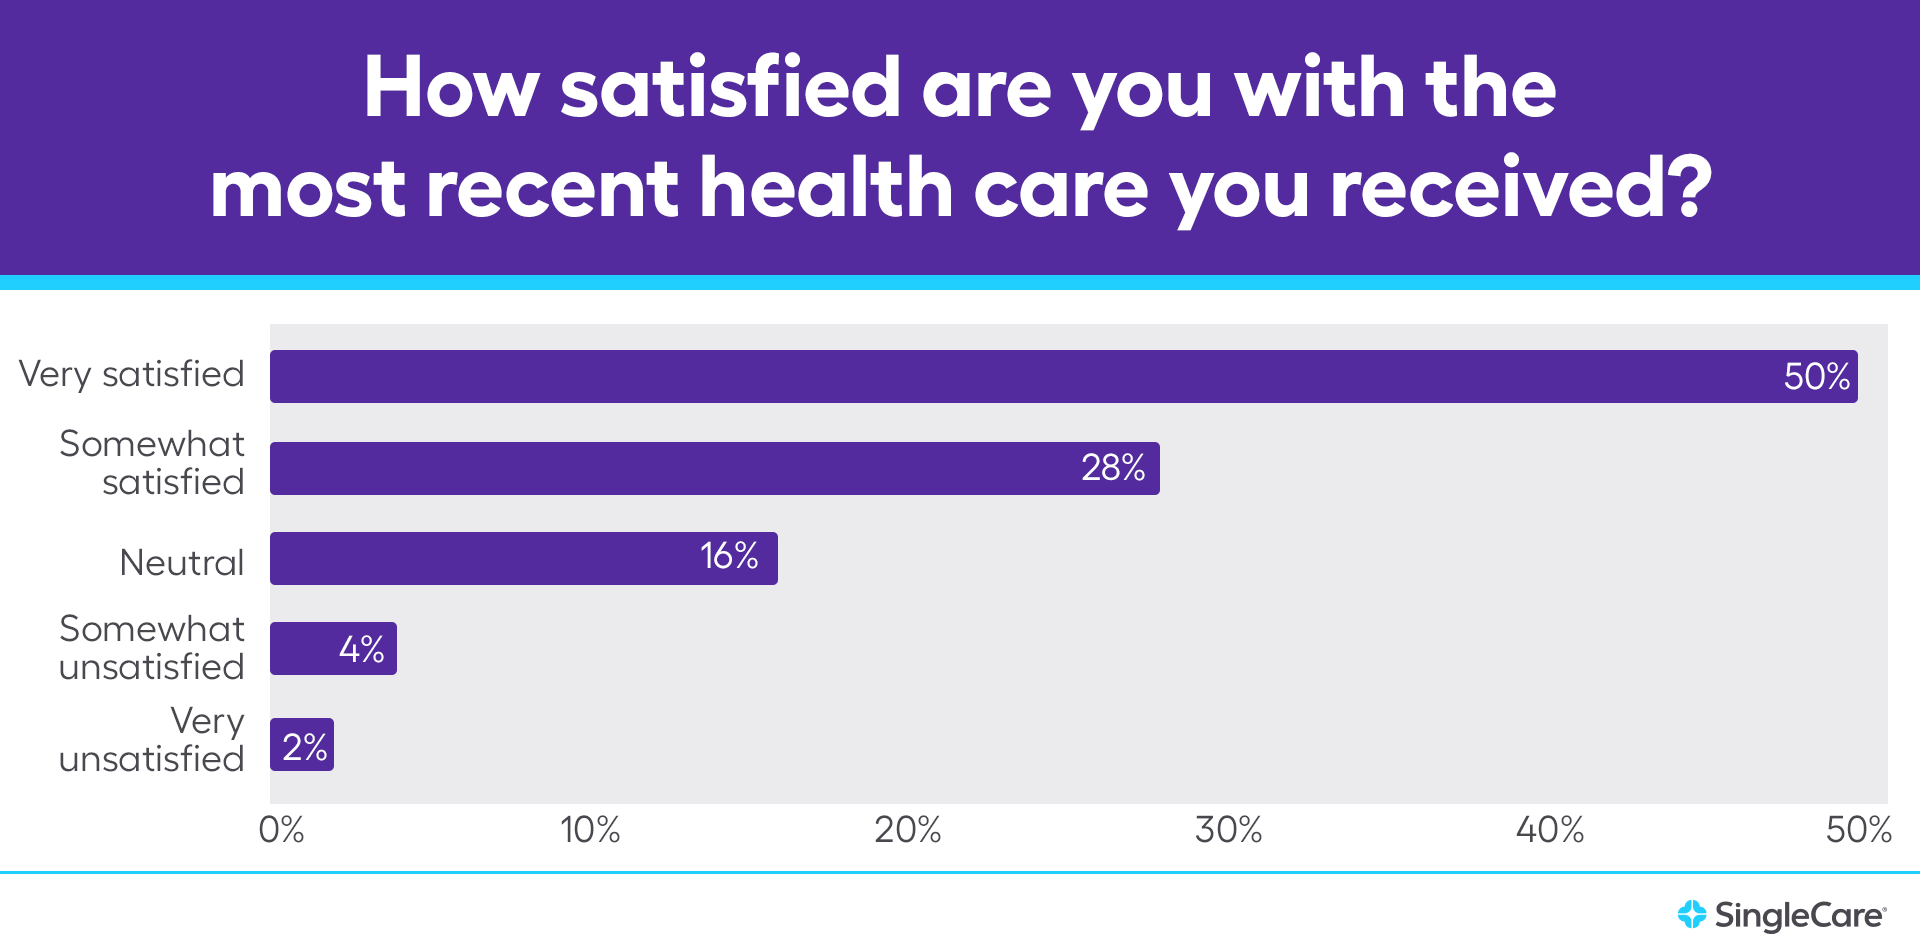
Patient satisfaction is critical to healthcare adherence. If a patient is unsatisfied with their healthcare experience, they may choose to not follow up with their provider, choose a different healthcare facility, or feel discouraged enough to delay health care altogether. Fortunately, our survey found that 94% of respondents have felt satisfied or neutral about their most recent healthcare experience.
- 50% were very satisfied
- 28% were somewhat satisfied
- 16% were neutral
- 4% were somewhat unsatisfied
- 2% were very unsatisfied
 We followed up with the 6% of respondents who reported feeling unsatisfied with their last healthcare experience. Ineffective treatment and a dislike or distrust for the healthcare provider were the most commonly reported reasons for an unsatisfactory experience.
- 39% reported an ineffective treatment
- 32% disliked the provider
- 31% didn’t trust the provider
- 22% had to wait too long
- 18% reported it was too expensive
- 15% reported other reasons for an unsatisfactory experience
- 14% received a misdiagnosis
- 11% reported their insurance didn’t cover it
- 8% reported none of the above
RELATED: How to find a doctor you can afford and trust
A third or more of respondents follow these four steps when they get sick
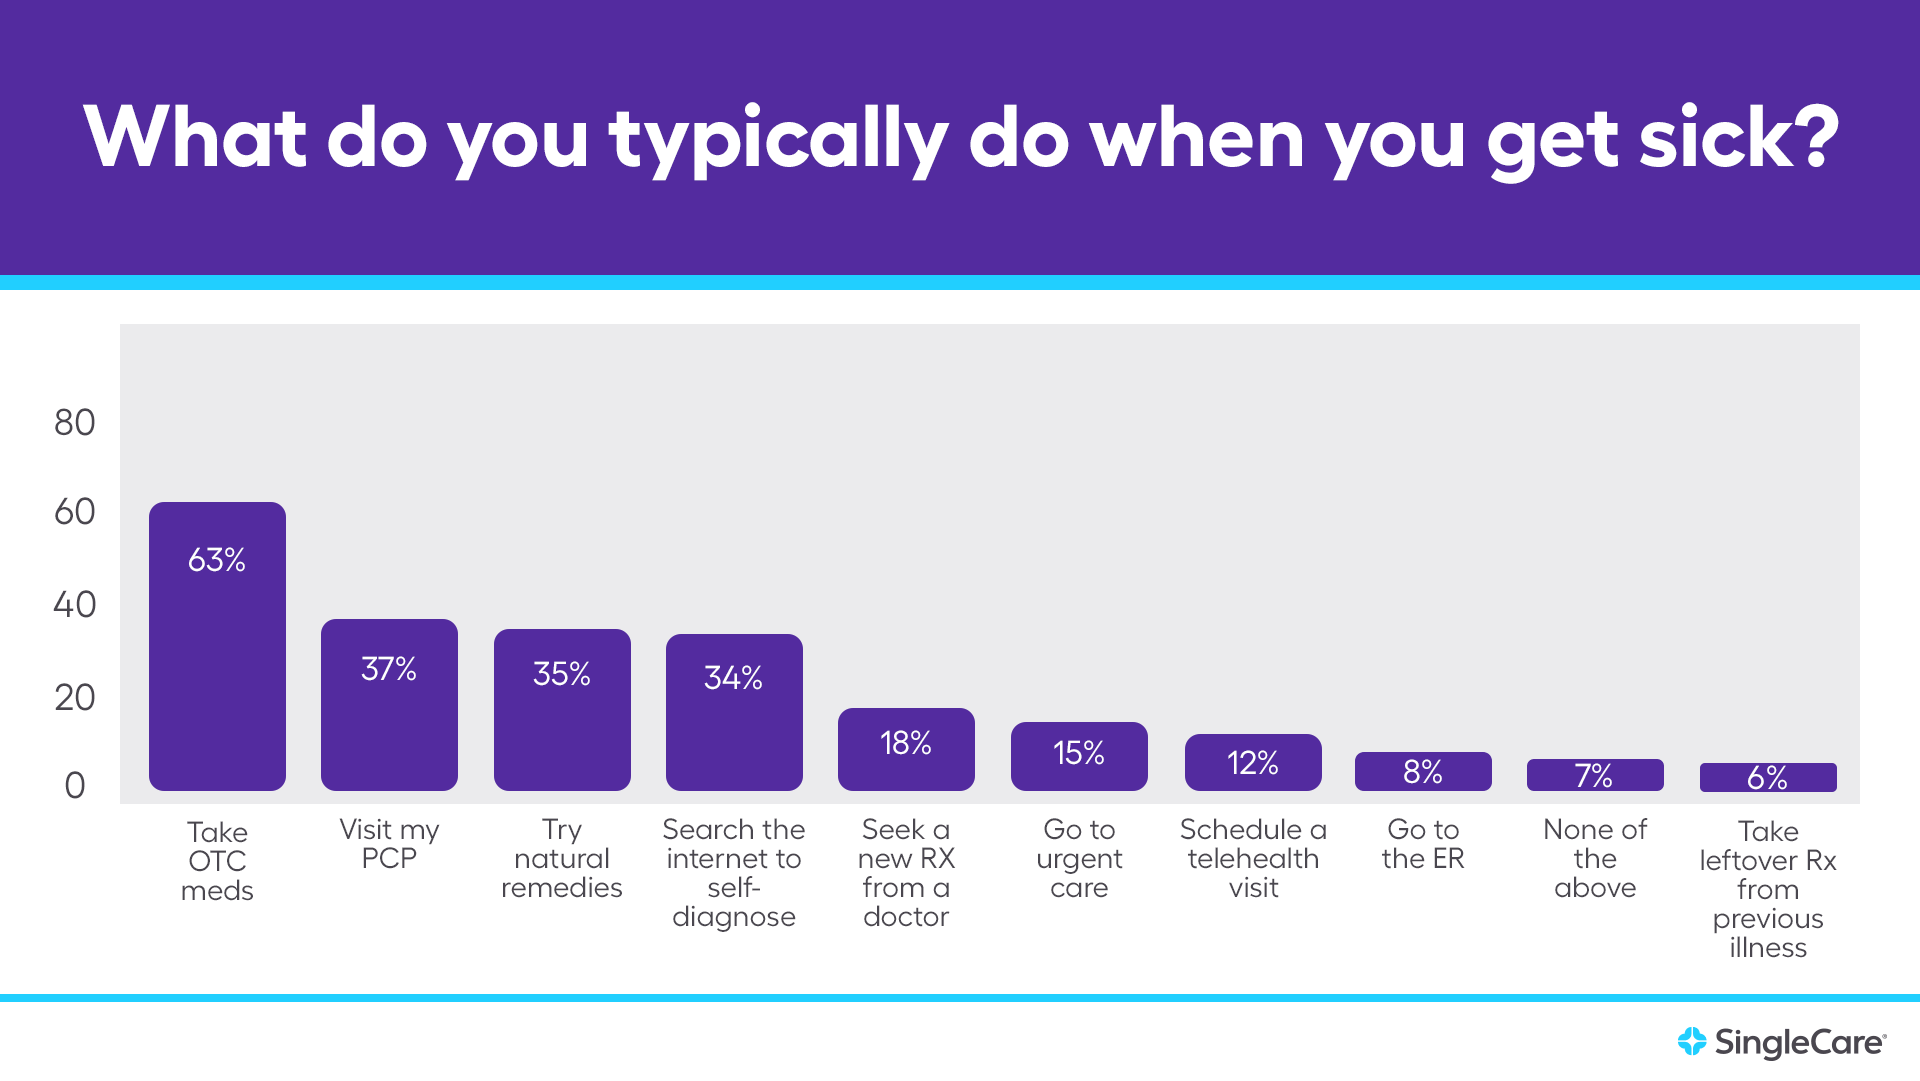
More than a third of respondents follow at least one of the same four steps when they feel sick: search the internet to self-diagnose their illness, try natural remedies, take over-the-counter medicine, and go to their primary care provider’s office. Less than 20% of respondents either seek new prescriptions, receive urgent or emergency care, or try telehealth.
- 63% take over-the-counter medicine
- 37% go to their primary care provider’s office
- 35% try natural remedies
- 34% search the internet to self-diagnose their illness
- 18% seek a new prescription from a doctor
- 15% go to urgent care
- 12% schedule a telehealth appointment
- 8% go to the emergency room
- 7% reported none of the above
- 6% take leftover prescription drugs from a previous illness
RELATED: Telehealth vs. telemedicine examples, pros, and cons
33% reported they would go to the emergency room for non-emergency health problems
According to the CDC, there were 130 million emergency room visits in 2018. However, many of these visits are for non-emergency situations. The result? Longer wait times and higher medical bills for everyone. Although cost should never deter someone from seeking emergency care when needed, it’s important to know when to see a physician versus seeking urgent or emergency care. We compiled a list of emergency and non-emergency medical situations and asked survey takers which illnesses or injuries they’d go to the ER for. The 1,500 respondents were able to choose multiple answers. Of the 7,262 responses we received, 2,413 responses (33%) were for non-emergencies.
When do you go to the ER? |
||
|---|---|---|
| Emergency or not?* | % of respondents who said they’d go to the ER |
|
| Broken bone or dislocated joint | Emergency | 71% |
| Chest pain | Emergency | 63% |
| Severe cuts or burns | Emergency | 57% |
| Abnormal or persistent bleeding | Emergency | 55% |
| COVID-19 symptoms | Non-emergency | 38% |
| Persistent vomiting or diarrhea | Non-emergency | 38% |
| Allergic reaction symptoms | Emergency | 36% |
| Fainting | Emergency | 29% |
| Difficulty or painful urination | Non-emergency | 27% |
| Stomach pain | Non-emergency | 19% |
| Sprain or strain | Non-emergency | 17% |
| Fever | Non-emergency | 9% |
| Migraine or headache | Non-emergency | 7% |
| Skin rash | Non-emergency | 7% |
*This list of emergencies is based on this list. This list should not discourage anyone from seeking emergency care. If you experience any symptoms that you personally deem as emergent, please seek immediate care or call your primary physician for their medical advice.
RELATED: Urgent care vs. emergency room visits
Many chronic diseases—some of which cause the symptoms listed above—are preventable. Receiving preventive care on a regular basis, adhering to medications as they’re prescribed, and maintaining healthy lifestyle habits can help patients avoid serious health complications and high medical bills.
Our methodology
SingleCare conducted this allergy survey online through AYTM on Jul. 30, 2021. This survey includes 1,500 United States adults ages 18+. Age and gender were census-balanced to match the U.S. population in age, gender, and U.S. region.
Lea este artículo en español aquí.
- Medically accurate: SingleCare’s Medical Review Board analyzes all of our content to confirm it’s in line with current medical advice.
- Evidence-based: Our content is sourced from reputable U.S.-based healthcare professionals and peer-reviewed research.
- Trustworthy: All of SingleCare’s content goes through a multi-phase review process by our writers, editors, and Medical Board in order to provide clear and credible information.