

These days, people can’t even sneeze without posting a photo on Instagram. No, really.
When you think of the popular photo-sharing platform, images of luxurious vacations, polished selfies, and plates piled high with chicken and waffles or other photogenic foods are sure to come to mind—not to mention celebrity babies and birthdays for us to ogle. However, just as Instagrammers are prone to sharing their most exciting and celebrated moments with the world on social media, many people are also showcasing life’s less glamorous moments.
Posting about having the flu and being sick is a more popular trend than you might realize. No matter the ache, pain, or sneeze, there’s likely a hashtag for that. In fact, these types of posts are so widespread that Finnish researchers were actually able to predict a flu epidemic using AI that analyzed flu-related social content.
Following in their footsteps, we analyzed thousands of Instagram posts with sickness-related hashtags to discover which states are airing their cold-related grievances online. We also wanted to figure out whether these patterns are in line with flu and allergy seasons. Grab a tissue, pour yourself some chamomile tea, and read on.
The seasonality of cold and flu hashtags
You’ve surely heard of the phrase “new year, new me”—an inspirational mantra that many people use to set the tone for a prosperous, productive new year. However, judging by the Instagram pictures analyzed, things are looking more like “new year, flu me.”
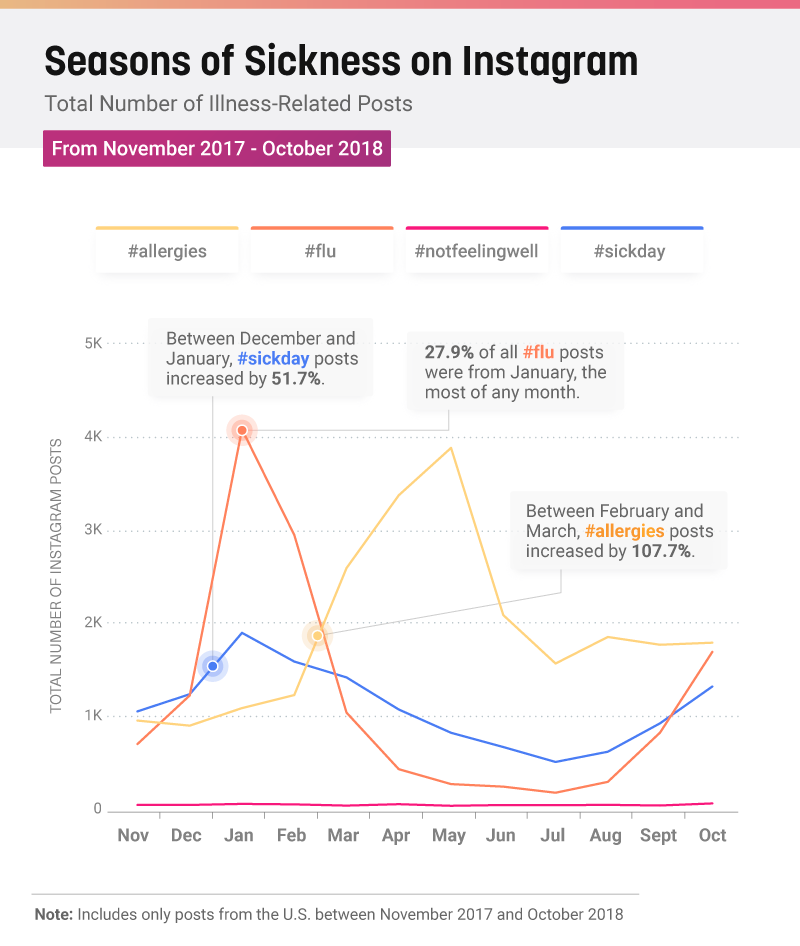
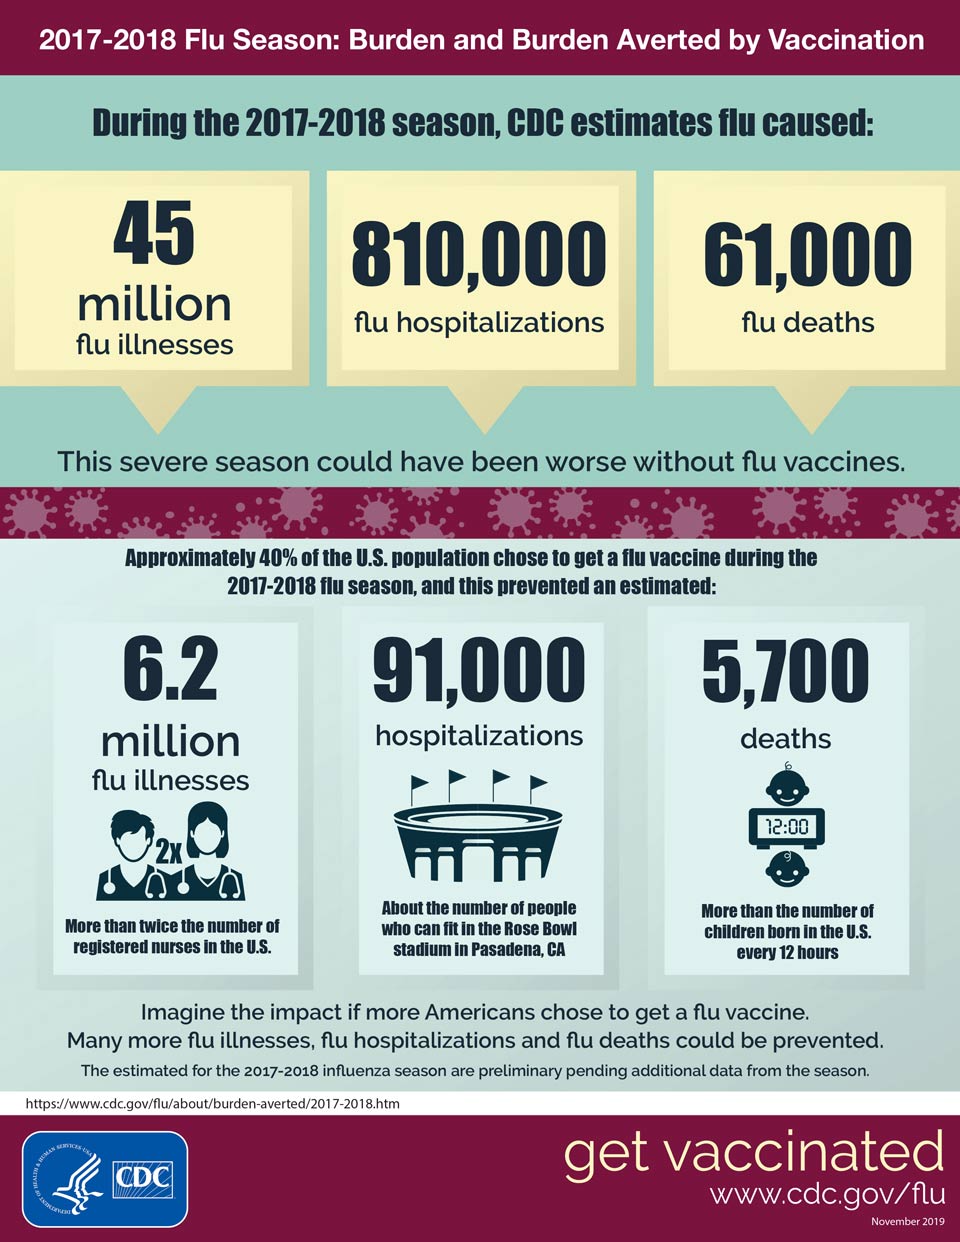
Posts bearing the #flu hashtag peaked astronomically right at the top of 2018: Nearly 28% of all flu-related images were published in the month of January. We observed another #flu peak in October 2018, two trends that were more or less aligned with the CDC’s 2017-2018 influenza report. This unforgiving illness started picking up speed in November and reached a (literal) fever pitch in January and February.
As the seasons changed from winter to spring, posts tagged with #allergies started to pick up: Between February and March, the amount of allergy-related content increased by 107.7 percent. Allergy posts also experienced a slight dip in July and were at their lowest levels during the winter months. “Tree season” (i.e., when trees flower) typically starts in March and ends in May, which mirrors the uptick in #allergy posts starting in February.
The #Flu-nited States
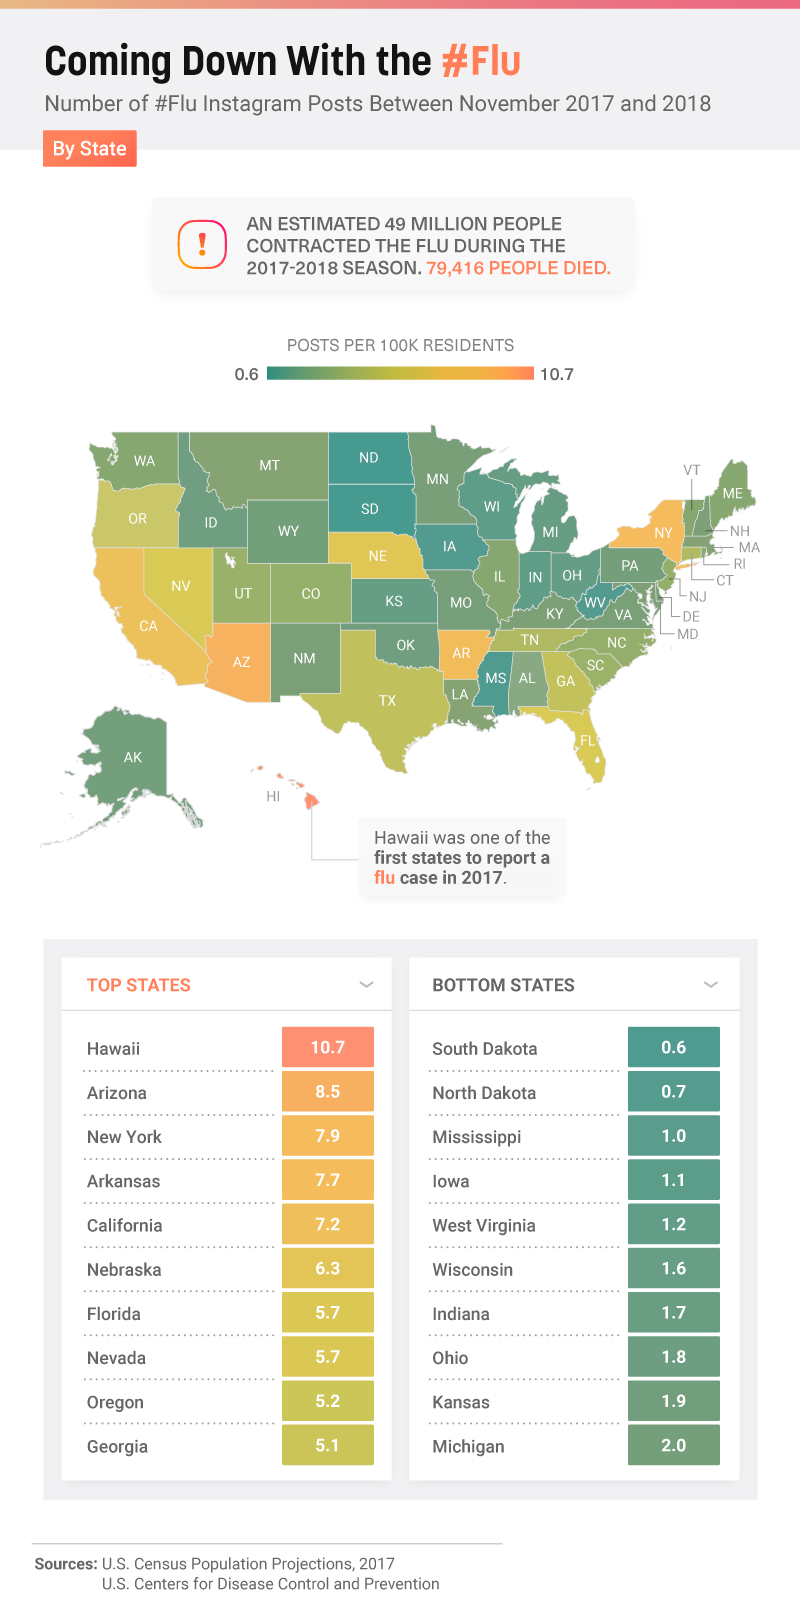
Ah, sunny Hawaii: known for its spectacular surf, unique coffee-growing abilities, and … flu-related Instagram posts? Indeed, this paradisiacal state was second to none when it came to publishing images with the hashtag #flu on Instagram, at 10.7 posts per 100,000 residents.
In 2018, Hawaii experienced one of its worst flu seasons on record since 2009, with a spike in cases having been reported right after the holiday season. And while 46 states were experiencing widespread flu activity at that time, Hawaiians may have taken to the internet in such large numbers due to the notable severity of the local flu season.
Coughers, sneezers, and feverish social media users in Arizona published the second-highest number of #flu-tagged Instagram posts during that same period, at 8.5 posts per 100,000 residents. Toward the tail end of 2017, Arizona experienced a serious influenza spike, with over 20,000 more cases recorded during the 2017-2018 season compared to the previous year.
Pollen problems
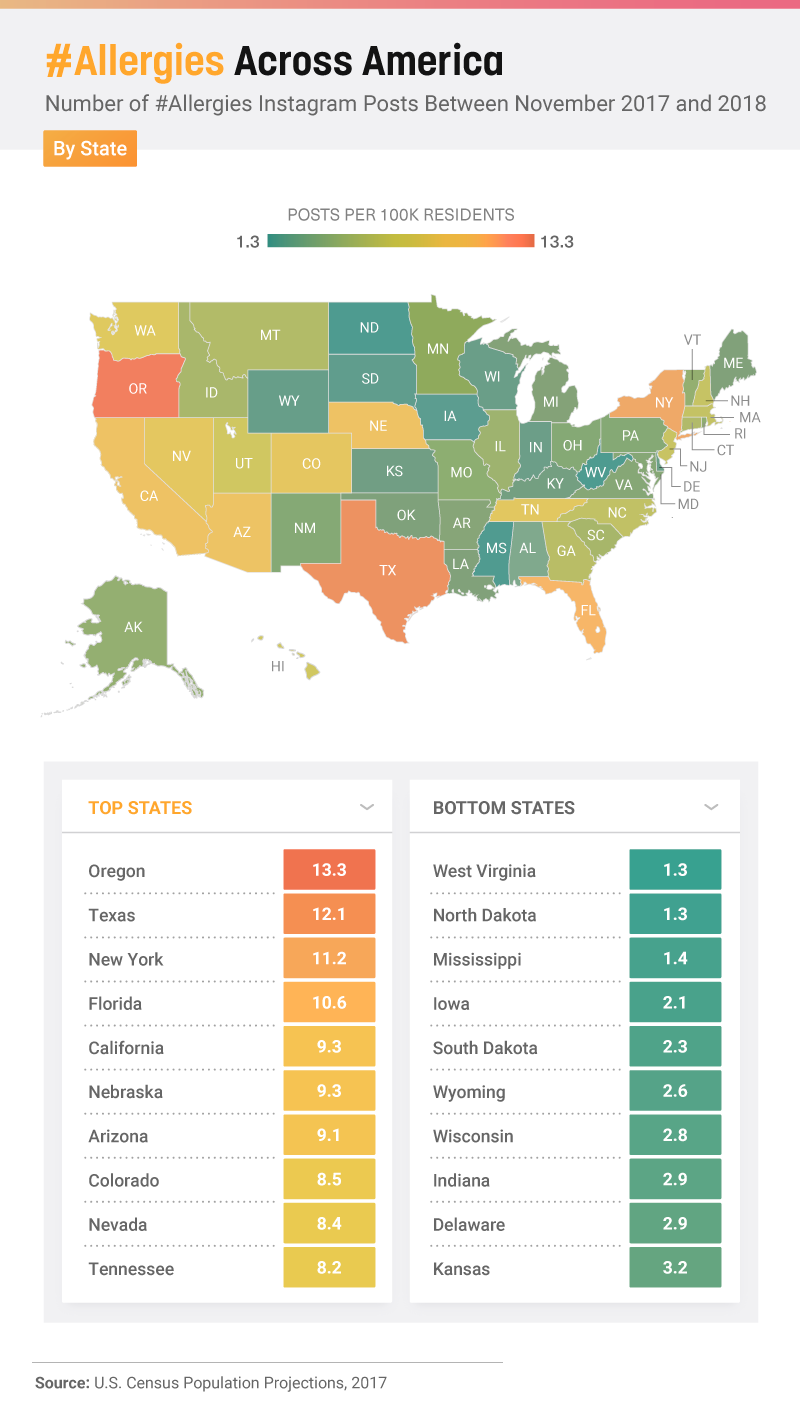
As the ragweed season gets longer by the year, you may encounter an increasing number of #allergies posts as you scroll through your Instagram feed. During the 2017-2018 season, however, it was Oregon that took the top spot by publishing 13.3 images with the #allergies hashtag per 100,000 residents.
Texas and New York weren’t far behind, with 12.1 and 11.2 #allergies posts per 100,000 residents, respectively. The former was hit fast and hard, not to mention earlier than usual, with their 2018 dose of tree pollen. In fact, according to the Asthma and Allergy Foundation of America (AAFA), McAllen, Texas, was the single most challenging place to live with fall allergies in 2018. Another Texas city, San Antonio, took fourth place.
As was the case with flu season, the prominence of allergies across the United States hit new highs last year: Due to factors like global warming and the associated changes in temperature, the concentration of pollen in the air is becoming more severe and is prolonging allergy-spurring events like ragweed season.
RELATED: Avoiding the ‘September Spike’ of allergy and asthma symptoms
Taking a #sickday
Sickness comes in all shapes and sizes. Every year, approximately 1 in 6 Americans fall ill due to foodborne illness, around 1 in 8 Americans get the flu, and millions more are hit with the common cold. The result: mountains of tissues, gallons of tea, and many #sickdays.
In 2017, nearly 60% of the American workforce took less than five days off work due to illness. About 1 in 5 workers under the age of 45 powered through and took no sick days at all, and very few took more than five days to recoup.
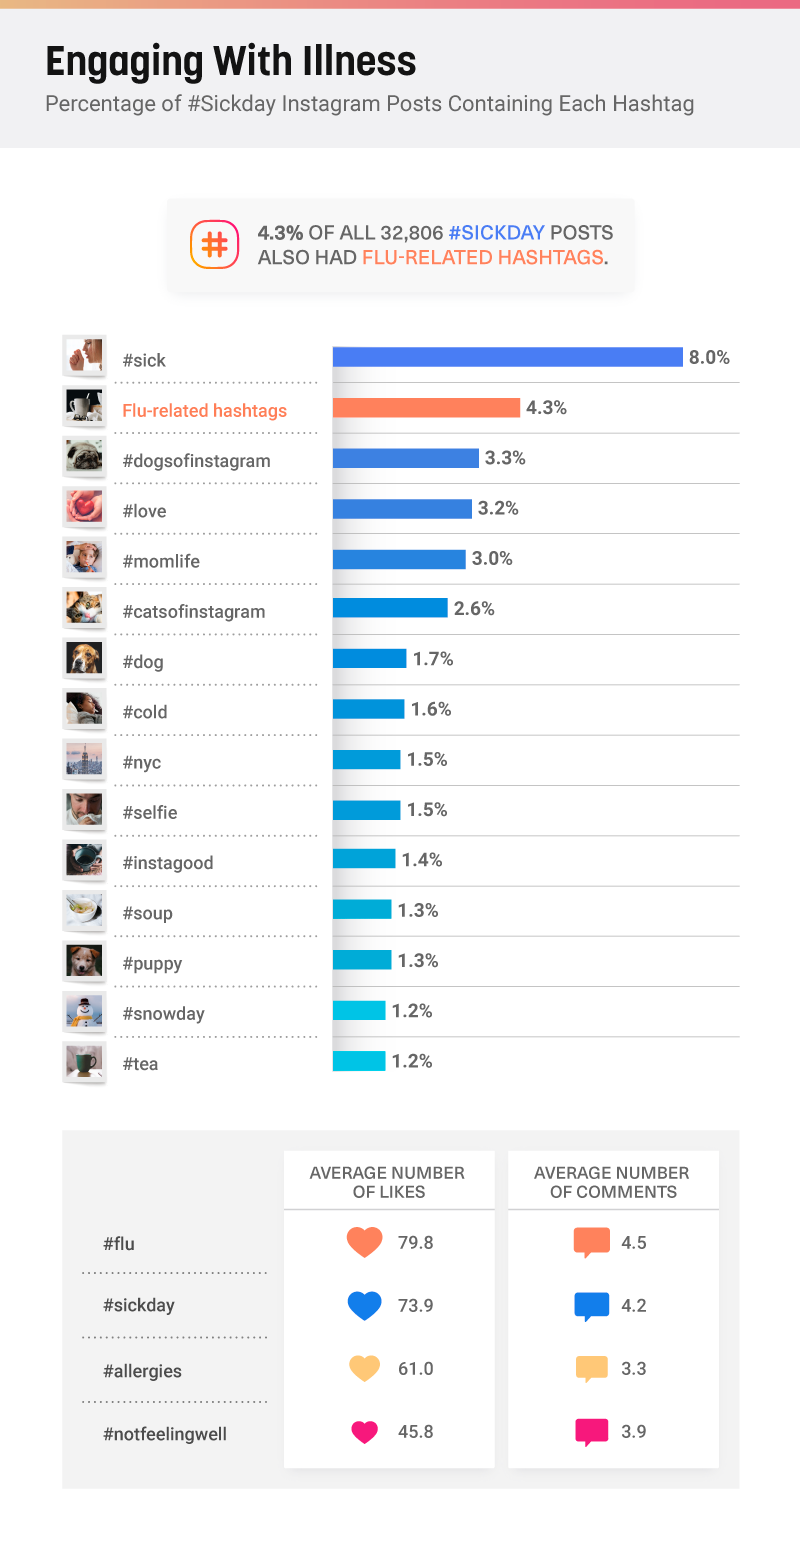
As it turns out, lying in bed with a cold was a highly relatable scene for a ton of Instagram users: The average post tagged with #sickday garnered nearly 74 likes and more than four comments, a close runner-up to #flu with an average of almost 80 likes and 4.5 comments.
Given that Instagram pictures are usually hashtagged by the paragraph, we found that #sick was the most common companion tag for #sickday, followed by flu-related hashtags. In third place was #dogsofinstagram—because what’s better medicine than a cuddle with your furry friend?
Smiling (or sulking) through sickness
While it can be tough to maintain a sunny attitude through sinus pressure or a sore throat, a fair number of Instagram posts bearing each illness-related hashtag had a positive spin to them.
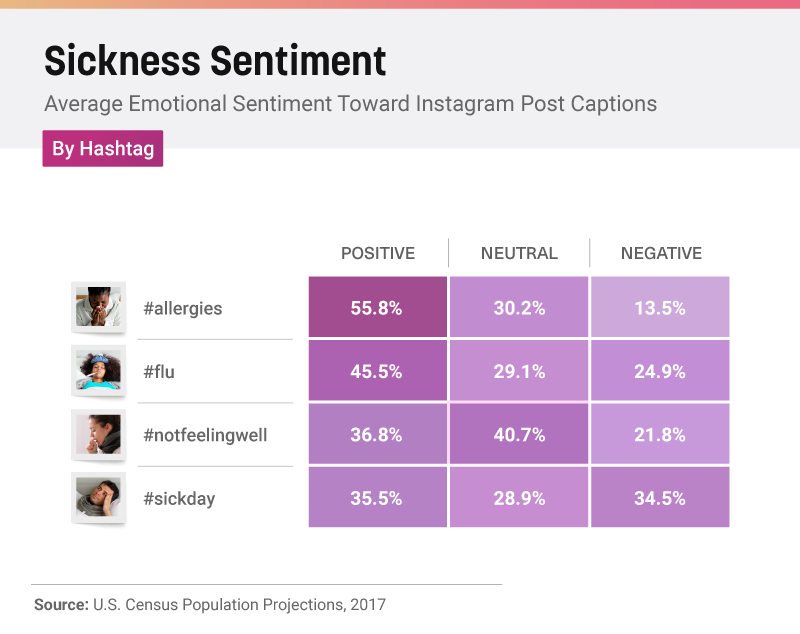
Captions attached to photos bearing the #allergies hashtag were the most optimistic of all, with 55.8% communicating positive emotions. Another 30.2% were neutral, and just 13.5% communicated more negative emotions. Meanwhile, 45.5% of posts with the hashtag #flu had captions that were positive, compared to 36.8% of #notfeelingwell and 35.5 percent of #sickday posts.
It might be tempting to wallow in your discomfort when you have a cold, but there is evidence you should fight against self-pity: Thinking positive thoughts has been known to help people heal faster and cope with illness better, from post-surgery recovery to serious diseases like cancer and AIDS. One theory: Pessimism releases harmful stress chemicals that can impede the immune system from functioning properly. So next time you’re under the weather, turn that frown upside down.
Conclusion: social media and health trends
In sickness and in health, Instagram is at your disposal for sharing your day-to-day moments with the world. In the winter, users were all about #flu posts, while the hashtag #allergies was most prominent during springtime. People tagged posts with #sickday more often during the winter, and the less-popular #notfeelingwell remained relatively static throughout the year.
The highest number of Instagram posts with the hashtag #flu came out of Hawaii, with Arizona not too far behind. And if you’re particularly susceptible to allergies, you might want to avoid Oregon and Texas during peak pollen season—these two states produced the highest volume of #allergies posts in the nation.
If it’s post engagement you’re after, might we recommend #flu and #sickday above other cold-related topics? These two hashtags garnered the highest number of likes and comments on average. For everything else, there’s SingleCare: your one-stop shop for affordable prices and easy access to prescriptions. Visit singlecare.com to search for your medication.
Methodology
For this analysis, we collected 127,174 Instagram posts using a Python tool. Posts collected were from the U.S. from Mar. 16, 2011, to Nov. 11, 2018. We gathered all data between Nov. 7 and Nov. 11, 2018.
To find the number of posts per capita, we also used 2017 population estimates from the U.S. census for all 50 states and the 90 cities with the largest populations.
Using the Influenza Positive Tests Reported to the CDC by Public Health Laboratories and ILI Activity, National Summary for 2017, in combination with census data, we also found the states with the highest numbers of positive influenza cases per capita. Data were not available for Wyoming, Rhode Island, New Jersey, or Florida.
Limitations
All of our findings are based on means alone and are exploratory. Of course, posts on social media have no direct correlation to actual illness rates. Additionally, we did not statistically test any of our findings or claims.
Sources
https://www.cdc.gov/flu/about/season/flu-season-2017-2018.htm
https://www.nbc15.com/content/news/Tree-allergy-season-delayed-due-to-winter-weather-479941653.html
https://www.cnn.com/2018/09/26/health/flu-deaths-2017–2018-cdc-bn/index.html
https://www.epa.gov/climate-indicators/climate-change-indicators-ragweed-pollen-season
https://www.dallasnews.com/news/public-health/2018/03/10/allergy-season-already-rip-roaring-start
https://www.aafa.org/media/2183/AAFA-2018-Fall-Allergy-Capitals-Report.pdf
https://www.vox.com/science-and-health/2018/3/14/17109336/allergies-climate-change-pollen
https://www.cdc.gov/foodborneburden/2011-foodborne-estimates.html
https://www.cdcfoundation.org/businesspulse/flu-prevention-infographic
https://www.cdc.gov/features/rhinoviruses/index.html
https://www.statista.com/statistics/682924/sick-leave-days-among-adults-us-by-age/
https://psychcentral.com/lib/the-power-of-positive-thinking/
- Medically accurate: SingleCare’s Medical Review Board analyzes all of our content to confirm it’s in line with current medical advice.
- Evidence-based: Our content is sourced from reputable U.S.-based healthcare professionals and peer-reviewed research.
- Trustworthy: All of SingleCare’s content goes through a multi-phase review process by our writers, editors, and Medical Board in order to provide clear and credible information.