

Key takeaways
Medicaid’s purchasing power is a critical factor in negotiating prescription drug prices, which impacts the cost and distribution of medications in the U.S.
The Affordable Care Act’s Medicaid Expansion significantly increased enrollment and prescription reimbursement costs, highlighting the program’s growing role in healthcare access.
A small number of expensive medications for chronic illnesses (such as the hepatitic C drug Harvoni) drive a substantial portion of Medicaid’s prescription costs, despite a high volume of prescriptions for common, less expensive drugs, such as amoxicillin and ibuprofen.
Geographic disparities in Medicaid prescription coverage reflect differences in state health priorities, legislation, and demographic needs, influencing local healthcare strategies and outcomes.
Americans pay an average of approximately $1,200 a year for prescriptions—and that figure represents out-of-pocket costs alone.
The rest of the prescription price tag falls to employers and to insurance providers, including federal and state programs such as Medicaid, which cover more than 70 million people. Some insist that Medicaid administrators must negotiate with drug manufacturers, using their purchasing power to drive down prices. Put simply, Medicaid spending on prescription drugs is both controversial and complicated. We set out to study the data behind the debate.
We analyzed Medicaid’s State Drug Utilization Data, a comprehensive record of how Medicaid beneficiaries across the country purchase prescriptions. Our findings show which states’ programs are spending the most and which drugs are used most often. To truly understand America’s use of expensive prescriptions, keep reading.
Medicaid prescription prices and popularity
A small number of medications account for a sizable percentage of Medicaid reimbursements, including prescriptions associated with the treatment of common ailments. Between 2009 and 2018, Medicaid covered 212,663,453 prescriptions for amoxicillin, an antibiotic used to treat conditions ranging from pneumonia to urinary tract infections. Ibuprofen prescriptions were similarly common, although this medication is also available over the counter. Hydrocodone, a medication used to treat pain, was prescribed 191,159,584 times during the period studied.
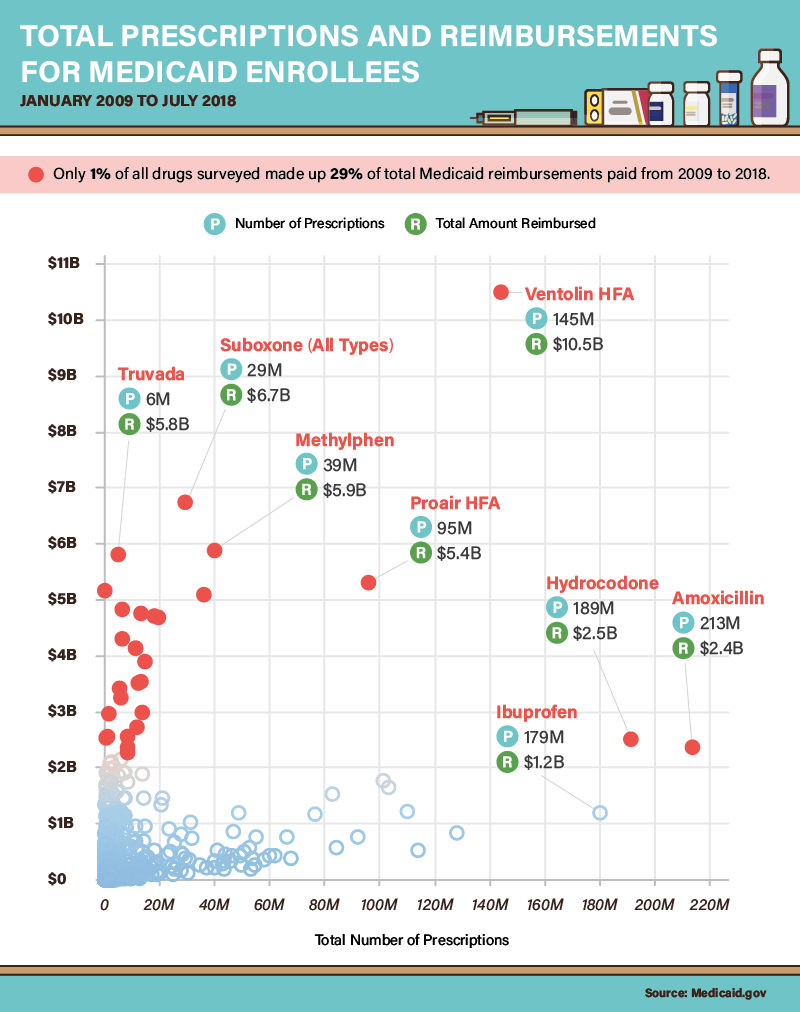
In terms of total reimbursement costs, however, Medicaid’s largest bills came from relatively expensive medications designed to treat chronic illnesses. Truvada, which suppresses the symptoms of HIV and prevents transmission of the virus, cost Medicaid $5.8 billion (critics claim the drug’s manufacturer charges an exploitative price for its product). Similarly, Suboxone cost Medicaid $6.7 billion between 2009 and 2018, although that sum paid for fewer than 30 million prescriptions. The drug, designed to treat opioid dependence, remains heavily regulated.
A Medicaid enrollment explosion
In the years following the passage of the Affordable Care Act, 37 states elected to adopt “Medicaid Expansion” plans, extending coverage to millions of Americans who did not qualify previously. As a result, Medicaid participation increased substantially between 2013 and 2017, from 56,533,472 people to 74,775,710. During that period, the program’s prescription reimbursement costs rose by $17 billion as well. Yet, both measures fell slightly in 2018, a development that some experts attribute to the robust economy. As workers earn more, they exceed income thresholds for Medicaid coverage, reducing the program’s rolls. Another cause of reduced participation may be new work requirements, which the Trump administration has urged states to implement in recent years.
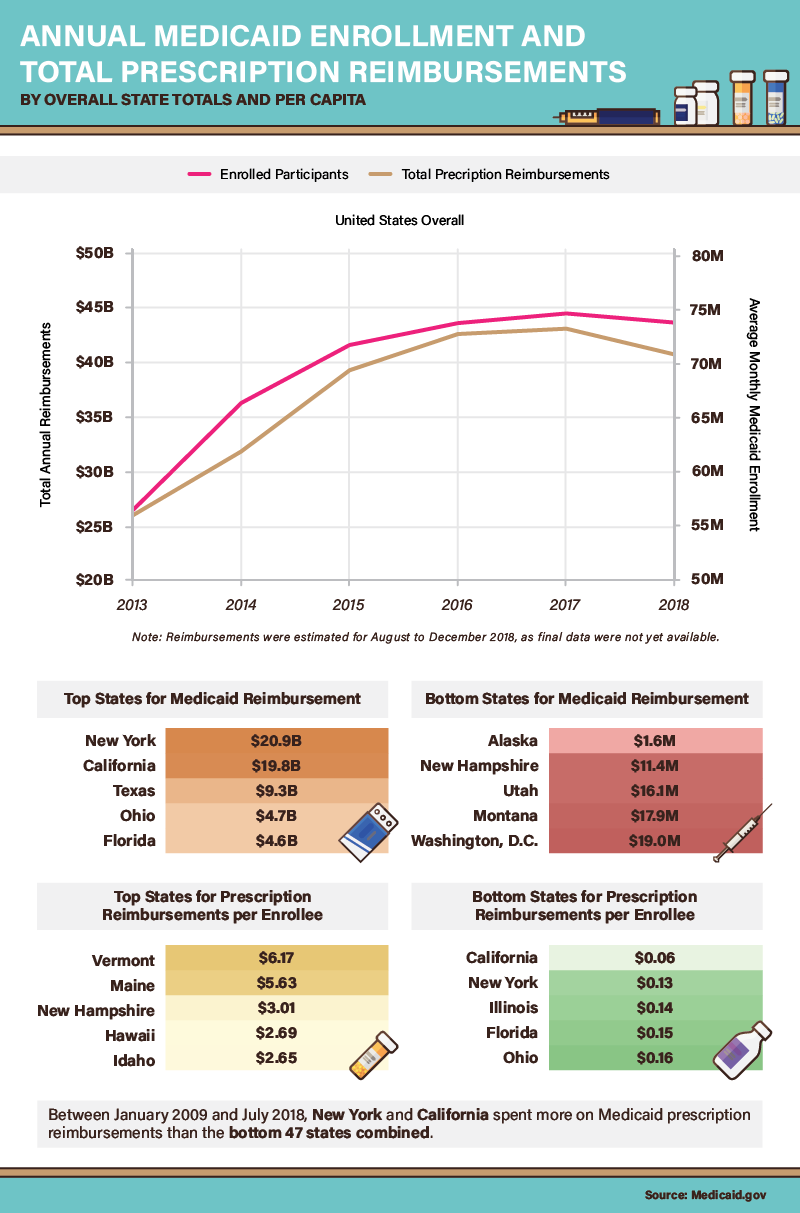
Many of the nation’s most populous states had the largest prescription reimbursement totals. In fact, state-by-state cost differentials were enormous: New York, California, and Texas spent significantly more than the other 47 states combined during the period studied. But with regard to Medicaid spending per capita, New York and California had some of the nation’s lowest costs—less than 15 cents per enrollee. By contrast, a few New England states seemed exceedingly generous: Vermont, Maine, and New Hampshire paid over $3 per enrollee in prescription reimbursements.
A surge in scripts for Medicaid participants
As Medicaid enrollment grew between 2013 and 2017, the number of prescriptions obtained through Medicaid also increased significantly. To some extent, these findings are intuitive: As more people participate in the program, the need for medication grows accordingly. Yet, state data adds a layer of complexity to this simple correlation. Some of the nation’s most populous places, including California, New York, Texas, and Florida, averaged less than 0.3 prescriptions for every 1,000 enrollees. At the other end of the spectrum, Vermont’s Medicaid program covered nearly six prescriptions for every 1,000 participants. What might explain these vast geographical differences in medical need?
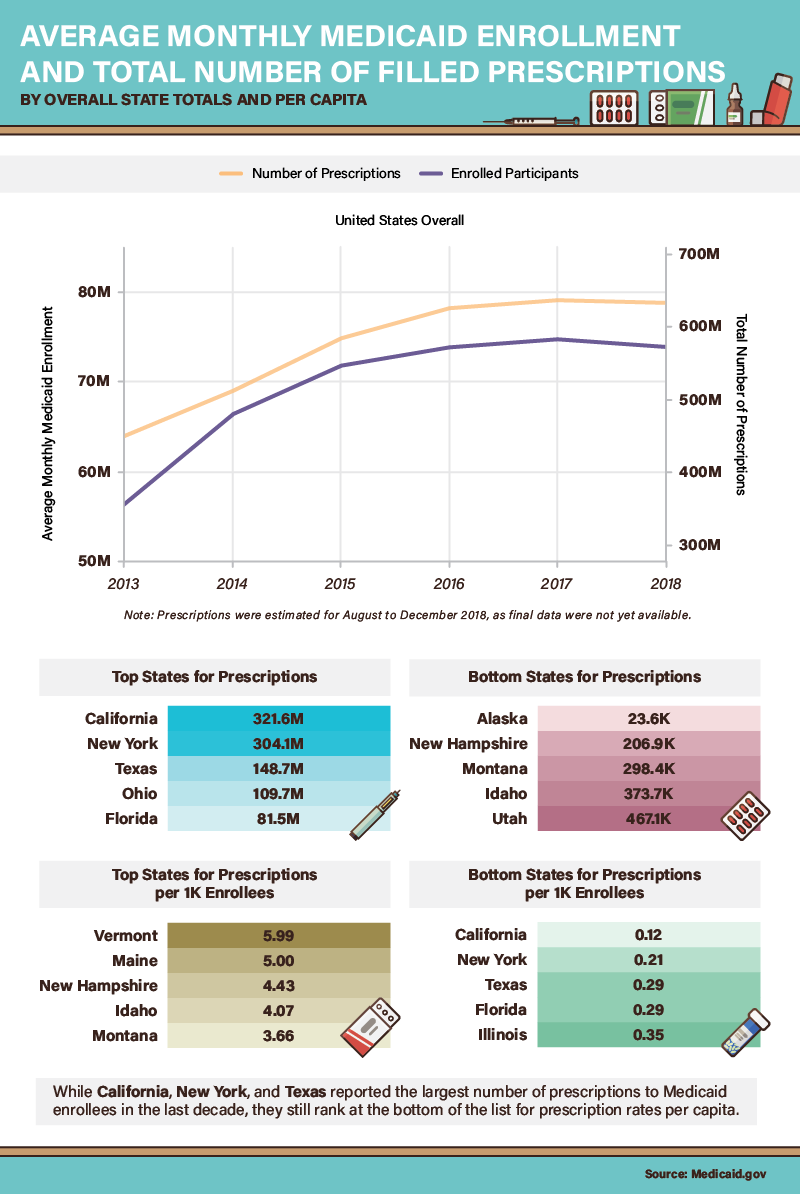
One explanation for these prescribing patterns may relate to age: Maine, New Hampshire, and Vermont have among the oldest state populations by percentage of total population, so average residents may need more medications as a result. But in states on both ends of the per-capita prescription spectrum, local legislators have recognized the impact of pharmaceutical prices on their Medicaid programs. In 2018, Vermont became the first state to legalize the importation of prescription drugs from Canada, capitalizing on cheaper prices across the border. In California, Gov. Gavin Newsom directed Medicaid to negotiate prescription pricing directly with drug manufacturers in a bid for better terms.
Medicaid drug coverage
Many of the drugs most frequently prescribed to Medicaid enrollees did not drive reimbursement costs. But Ventolin HFA (albuterol), a rescue inhaler used to treat asthma, bucked this trend: As the most commonly prescribed medication, it accounted for $10.5 billion in reimbursements. Several less popular asthma medications also proved costly to Medicaid, including Fluticasone and Symbicort. Some research indicates that asthma is far more common among children and adults living in lower-income households—and Medicaid is explicitly designed to serve these groups.
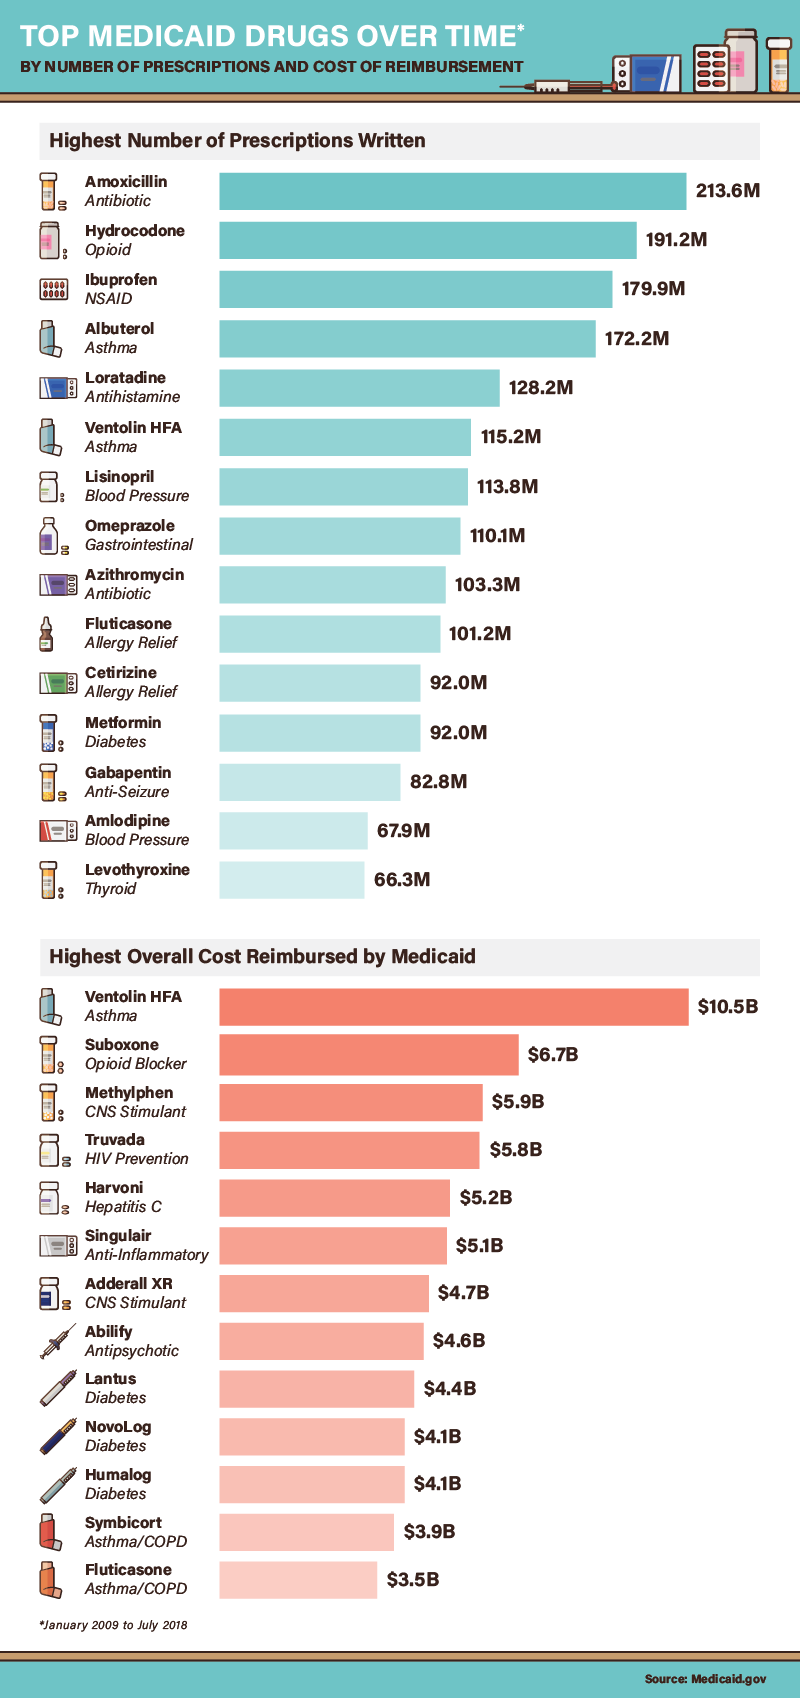
Three diabetes medications also cost Medicaid programs more than $4 billion apiece in reimbursements. This finding may also reflect health conditions of lower-income Americans, who have far higher rates of diabetes than other socioeconomic groups. Harvoni, a medication proven to treat hepatitis C, accounted for more than $5 billion in reimbursements. Medicaid administrators are deeply concerned that reimbursements for the drug may prove unsustainable. The average 12 week course of Harvoni costs $94,500, a rate that would financially burden state Medicaid programs if every enrollee with hepatitis C received this treatment.
Highest Medicaid reimbursement costs
For six medications, Medicaid reimbursements exceeded $1,000 per dose on average. The most expensive overall was Synagis, which can help prevent respiratory syncytial, a common condition in infants and older adults. Epogen, an anemia treatment, costs $1,857 per dose—a particularly steep price considering that anemia is often a side effect of other expensive medical treatments, such as chemotherapy. Two antipsychotic medications, Invega and Risperdal, also proved exceptionally expensive per dose.
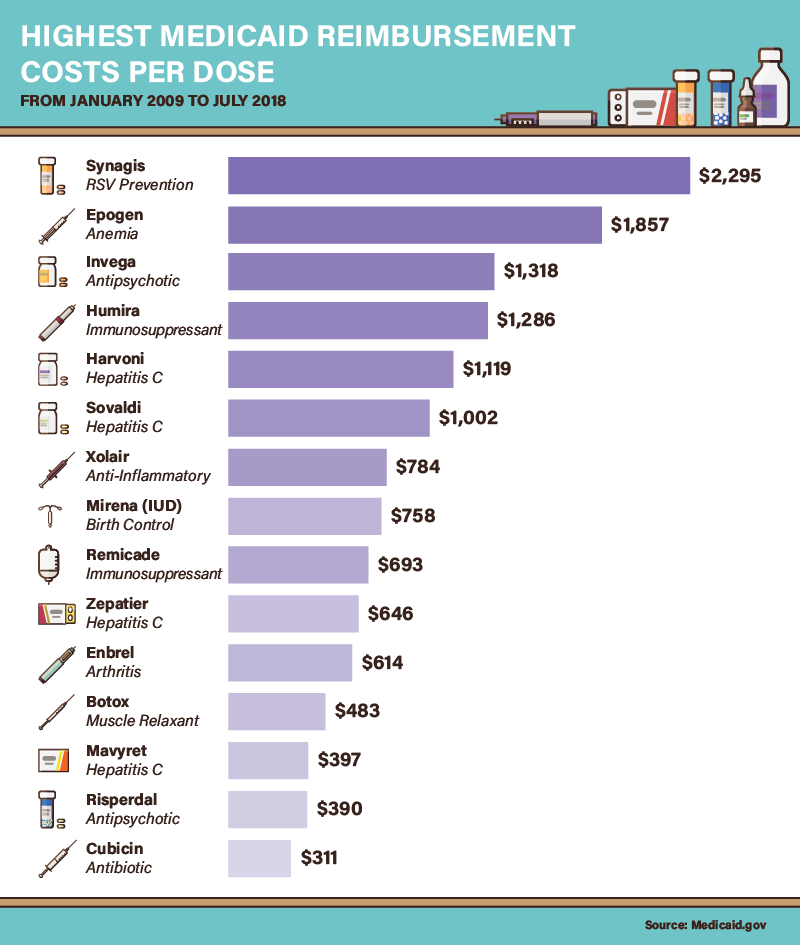
As discussed above, Harvoni was among the most expensive medications per dose, as were three other hepatitis C treatments. Two immunosuppressants, Humira and Remicade, also made this list (Humira can also be self-injected, potentially lowering costs). Meanwhile, Mirena, an intrauterine device designed to prevent pregnancy, cost $758 on average—although this price may actually be lower than the cumulative expense of birth control pills over time. Medicaid prescription coverage for birth control remains controversial in some states, but advocates say it reduces program costs in the long run by preventing unplanned pregnancies.
Mapping medication
In nearly every state, specific medications were covered exceedingly often by Medicaid. Often, the disproportionate use of a particular pharmaceutical resulted from state health initiatives. In Vermont, for example, prescriptions for Suboxone were 805% higher than the national average: The drug has become an essential part of its “hub and spoke” model for treating opioid dependence. New Jersey, which has emphasized combating diabetes through Medicaid, covered alogliptin prescriptions nearly nine times more often than the national rate. In other cases, state policies seemed to privilege a specific form of a common medication. Oklahoma, for example, covered 562% more Tamiflu prescriptions than the national average. Indiana, meanwhile, was 738% more likely to cover oseltamivir, the generic equivalent.
The prescribing tendencies of other states might raise concerns on the grounds of addiction risk, however. In North Carolina, for example, Medicaid covered 178% more morphine prescriptions than the national average. Likewise, Louisiana’s Medicaid program covered Soma, a muscle relaxant that can be abused, 216% more than the national average. In Kentucky, prescriptions for the benzodiazepine Ativan were common. Many experts believe this class of drug may represent the next major public health threat, with prescribing rates increasing significantly in recent decades.
An influx of Naloxone (Narcan) prescribing
As the opioid crisis continues to ravage American communities, the federal government is increasingly turning to medication-assisted treatment methodologies as a means to curb overdose deaths. And while some state Medicaid programs do not directly reimburse for medications designed to treat opioid withdrawal, many of the places with the highest overdose death tolls do. Buprenorphine, the primary ingredient in Suboxone, was directly reimbursed across the Northeast, Appalachia, and large chunks of the Midwest—the regions hit hardest in per-capita terms.
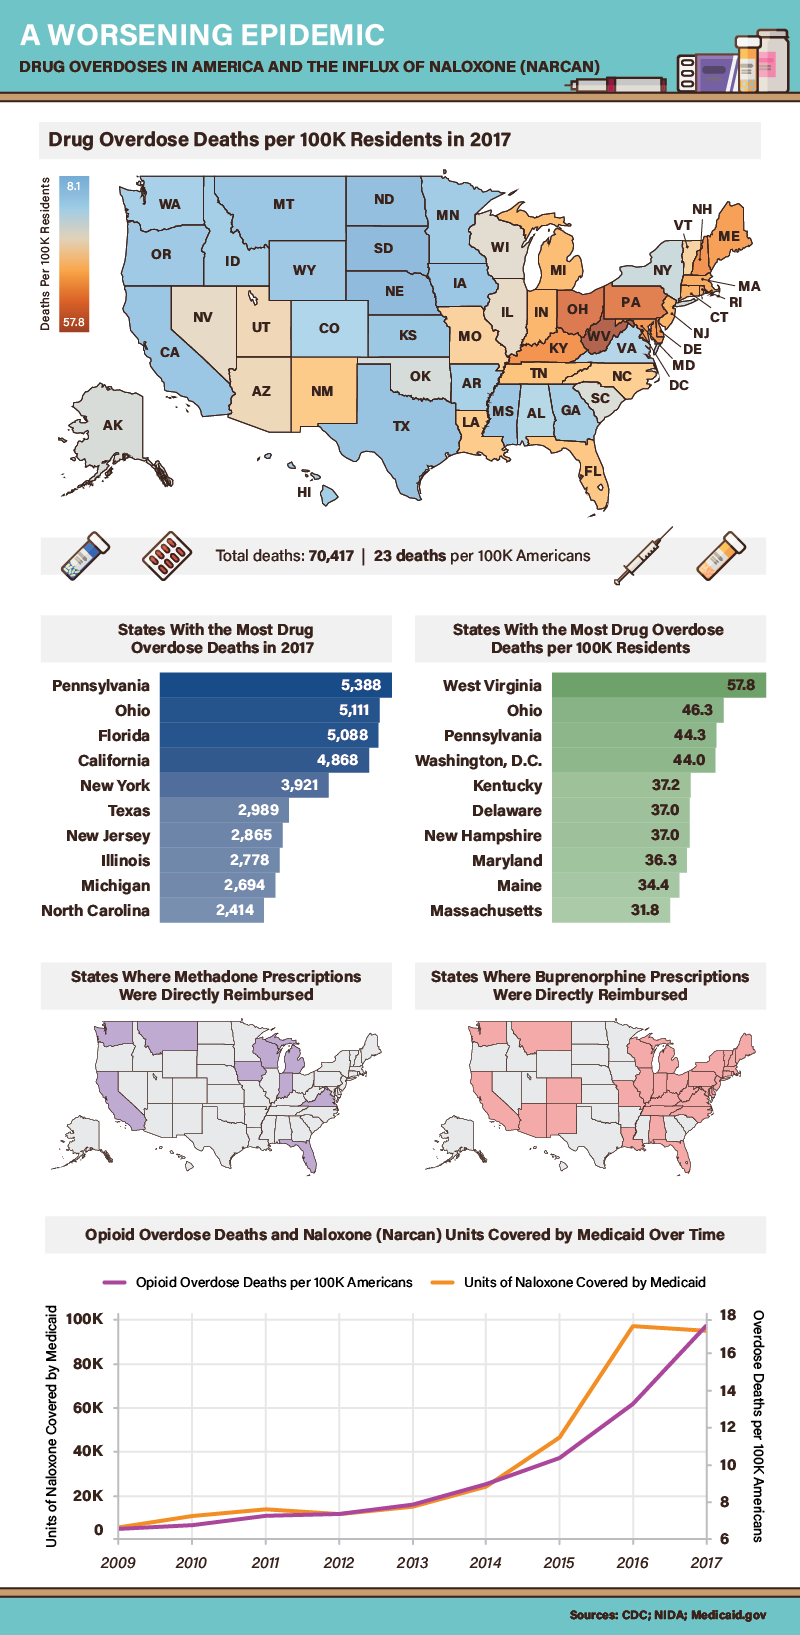
Methadone reimbursement was somewhat less common than coverage for buprenorphine, although research indicates both medicines are effective in reducing overdose deaths among former opioid users. Yet, another medication may have saved even more lives in recent years: naloxone, an opioid antagonist used to reverse overdoses. Historically, the number of naloxone prescriptions among Medicaid enrollees has increased in step with overdose deaths. Yet, in 2016, the number of naloxone prescriptions covered by Medicaid actually fell slightly, even as overdose deaths reached unprecedented levels that year. This counterintuitive development could have a simple explanation: In places such as Pennsylvania, which had the greatest total number of overdose deaths in 2017, authorities have begun distributing naloxone for free.
America’s health: A high price to pay
Our findings present fascinating differences in the use of prescription medications among Medicaid enrollees across the country. In each case, divergent prescribing patterns could stem from a host of factors, including regional health threats, bureaucratic procedures, and the demographic composition of each state. But while our results may vary widely, two essential themes consistently emerge.
First, no state is immune to soaring pharmaceutical costs, but some places find prescription prices particularly challenging. Second, the most costly and prescribed medications are necessities—not luxuries—for those who need them. For Medicaid enrollees and all other Americans, these conflicting realities are too important to ignore.
If you have Medicaid drug coverage but your copay is still too high, you can always search SingleCare for your prescription. Here are just a few of the thousands of drugs we can offer discounts on:
- Amoxicillin
- Ibuprofen
- Albuterol
- Loratadine
- Ventolin HFA
- Lisinopril
- Omeprazole
- Azithromycin
- Fluticasone
- Cetirizine
- Metformin
- Gabapentin
- Amlodipine
- Levothyroxine
Methodology
All data for this project was sourced from the U.S. government’s Medicaid State Drug Utilization Data via API access. The data collected cover Jan. 2009 to Jul. 2018 (end of Q2). Many variants of the same chemical compound that are distributed and categorized as different entities in the Medicaid data were grouped (for example, “Suboxone,” “Suboxone 1,” “Suboxone 2,” “Suboxone 4,” “Suboxone 8,” and “Suboxone S” were all grouped). For 2018 data that were summed (rather than averaged), we provided a visual estimate range for final figures based on a confidence interval calculation. Data for the final graphic (on opiate overdoses) were sourced from the Centers for Disease Control and Prevention (CDC) and the National Institute on Drug Abuse.
Sources
- https://thehill.com/policy/healthcare/420701-the-year-ahead-drug-pricing-efforts-to-test-bipartisanship
- https://www.cnbc.com/2019/01/10/why-prescription-drugs-in-the-us-cost-so-much.html
- https://www.medicaid.gov/medicaid/index.html
- https://www.pewtrusts.org/en/research-and-analysis/blogs/stateline/2018/05/30/trump-wants-medicaid-to-push-for-lower-drug-prices-but-will-patients-be-hurt
- https://www.medicaid.gov/medicaid/prescription-drugs/state-drug-utilization-data/index.html
- https://medlineplus.gov/druginfo/meds/a685001.html
- https://www.reuters.com/article/us-health-nsaids-overdosing/many-people-take-dangerously-high-amounts-of-ibuprofen-idUSKBN1FS336
- https://medlineplus.gov/druginfo/meds/a614045.html
- https://www.healthline.com/health-news/cost-of-hiv-prevention-drug-discouraging-people-from-doing-prep-therapy#3
- https://www.npr.org/sections/health-shots/2018/10/05/653360644/addiction-treatment-gap-is-driving-a-black-market-for-suboxone
- https://www.kff.org/medicaid/issue-brief/status-of-state-medicaid-expansion-decisions-interactive-map/
- https://www.cnbc.com/2018/10/24/strong-economy-halts-medicaid-growth-as-more-americans-make-too-much.html
- https://www.census.gov/newsroom/press-releases/2017/estimates-idaho.html
- https://www.pressherald.com/2018/09/13/maine-still-nations-oldest-state/
- https://www.politico.com/story/2018/05/16/vermont-drug-imports-canada-546107
- https://www.livescience.com/43824-albuterol.html
- https://nursing.usc.edu/blog/does-race-increase-chances-of-asthma/
- https://www.upi.com/Link-between-poverty-obesity-developed-in-last-30-years/1741544541586/
- https://www.nbcnews.com/health/health-news/hepatitis-c-cure-eludes-patients-states-struggle-costs-n870846
- https://www.cdc.gov/rsv/index.html
- https://www.webmd.com/drugs/2/drug-413/epogen-injection/details
- https://www.cnn.com/2018/11/13/health/mental-health-medicaid-waiver/index.html
- https://www.verywellhealth.com/comparing-enbrel-remicade-and-humira-drugs-189233
- https://www.medicalnewstoday.com/articles/314368.php
- https://khn.org/news/states-extend-medicaid-for-birth-control-cutting-costs-and-future-enrollment/
- https://www.vox.com/science-and-health/2018/11/20/18096123/opioid-epidemic-vermont-needle-exchange-buprenorphine
- https://www.chlpi.org/new-jersey-leads-nation-fighting-diabetes-innovative-treatments/
- https://medlineplus.gov/druginfo/meds/a699040.html
- https://www.webmd.com/drugs/2/drug-12153/soma-oral/details
- https://www.pewtrusts.org/en/research-and-analysis/blogs/stateline/2018/07/18/these-pills-could-be-next-us-drug-epidemic-public-health-officials-say
- https://www.hhs.gov/about/news/2018/05/30/samhsa-announces-196-million-funding-opportunity-opioid-treatment-grants-hardest-hit-states-and-tribes.html
- https://www.nih.gov/news-events/news-releases/methadone-buprenorphine-reduce-risk-death-after-opioid-overdose
- https://www.drugabuse.gov/related-topics/opioid-overdose-reversal-naloxone-narcan-evzio
- https://www.reuters.com/article/us-california-governor-newsom-health/new-california-governor-tackles-drug-prices-in-first-act-idUSKCN1P200D
- https://www.npr.org/sections/health-shots/2018/12/14/676518770/in-pennsylvania-people-lined-up-for-free-naloxone
- Medically accurate: SingleCare’s Medical Review Board analyzes all of our content to confirm it’s in line with current medical advice.
- Evidence-based: Our content is sourced from reputable U.S.-based healthcare professionals and peer-reviewed research.
- Trustworthy: All of SingleCare’s content goes through a multi-phase review process by our writers, editors, and Medical Board in order to provide clear and credible information.